Ethical statement
All experimental protocols received approval from the Animal Care and Use Committee of Kyushu University (Approval Number: A22-380). Rat handling and experimental procedures adhered to the Principles of Laboratory Animal Care and the ARRIVE guidelines.
Animals and reagents
Eight-to-nine-week-old male LEW and BN rats were sourced from SLC Japan Inc. (Tokyo, Japan) for this study. The rats were maintained under specific pathogen-free conditions with unrestricted access to food and water.
Lipopolysaccharide from Porphyromonas gingivalis (LPS-PG, standard, 1 mg/ml) was procured from InvivoGen (CA, USA). LEW rats were randomly assigned to two groups: a phosphate-buffered saline (PBS) group and LPS-PG group. Five rats in each group were used for the in vivo MLR assay and kidney transplantation experiments. LPS-PG or PBS was administered to each rat via the tail vein. A dose of 0.8 mg/kg LPS-PG was administered to the LPS-PG group rats, determined according to a previous study on the effect of ET on transplant immunity27. Blood samples from the tail vein were collected and serum samples were stored at − 80 ℃ until analyzed. Serum creatinine and blood urea nitrogen (BUN) levels were measured by a commercial service (Kyudo Company, Saga, Japan).
In vitro assay
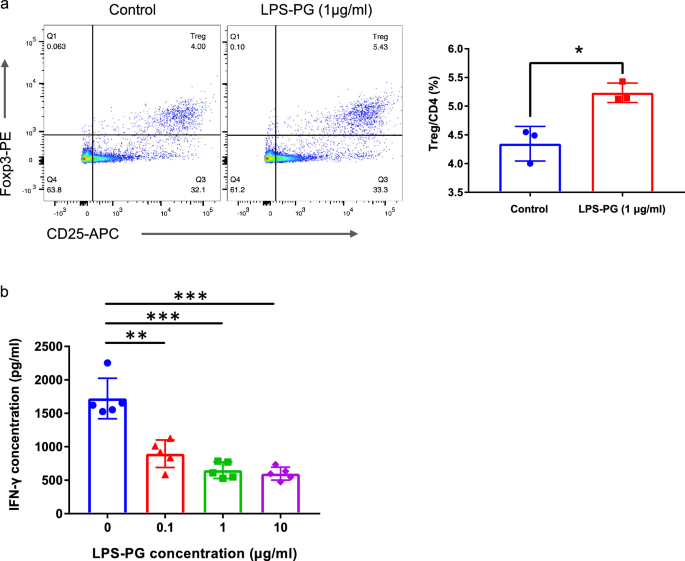
Spleen cells (2 × 10⁶ cells/ml) from LEW rats were cultured in 6-well plates and divided into two groups (n = 3 per group). The control group was cultured in RPMI-1640 medium (FUJIFILM Wako Pure Chemical Corporation, Osaka, Japan) supplemented with 10% fetal bovine serum, 50 μM 2-mercaptoethanol (Thermo Fisher Scientific, MA, USA), 1% Penicillin–Streptomycin Solution, and 1% sodium pyruvate (both from FUJIFILM Wako Pure Chemical Corporation). The LPS-PG group was cultured in the same medium with the addition of 1 μg/ml of LPS-PG. After 72 h, the cultured cells were collected and analyzed.
Mixed lymphocyte reaction culture
Spleen cells (2 × 10⁶ cells/ml) from LEW rats were co-cultured with 30 Gy irradiated spleen cells (2 × 10⁶ cells/ml) from BN rats in a 96-well flat-bottom microplate (200 μl/well; Nunclon Delta Surface, Thermo Fisher Scientific), for 3 days. LPS-PG was added to the culture at graded concentrations.
Enzyme-linked immunosorbent assay (ELISA)
Cell-free supernatants obtained after the MLR assay were used for the measurement of IFN-γ and rat serum collected 5 days after kidney transplantation was used for the measurement of IL-10 concentrations. This was accomplished using a Quantikine ELISA kit (R&D Systems, MN, USA), following the manufacturer’s instructions.
Flow cytometry
Hemolyzed peripheral blood samples and spleen cells were stained with PE/Cyanine7 anti-rat CD4 antibody (BioLegend, CA, USA), APC anti-rat CD25 (BioLegend), and PE anti-mouse/rat/human Foxp3 (BioLegend). For Foxp3 staining, samples were fixed and permeabilized using the Transcription Factor Buffer Set (BD Pharmingen, NJ, USA) following the manufacturer’s instructions. The stained cells were detected using a cell analyzer (FACS Verse, BD, NJ, USA) and analyzed with FlowJo software (BD).
Kidney transplantation
Surgery was conducted under isoflurane inhalation anesthesia. Left kidneys from BN rats were orthotopically transplanted into the abdomen of LEW rats. The renal artery, vein, and ureter were anastomosed using 10–0 nylon. The native right kidney of recipient LEW rats was removed at the end of the procedure. Animals were sacrificed 5 days after transplantation, and the kidney grafts, spleens, and peripheral blood were harvested. Animals that died within 4 days after surgery were considered to have technical graft failure and were excluded from the study.
Histology and immunohistochemistry
The kidney grafts were extracted, fixed with 4% paraformaldehyde, dehydrated, and embedded in paraffin. Subsequently, the specimens were sectioned into 4 μm slices. Periodic Acid-Schiff staining was performed to evaluate tubulitis using a previously described scoring system as follows42: 250 tubular cross-sections per animal were examined and categorized as (i) normal, (ii) mild tubulitis (infiltration of one mononuclear cell per tubular cross-section), (iii) moderate tubulitis (infiltration of two or three mononuclear cells per tubular cross-section with disruption of the basement membrane), or (iv) severe tubulitis (defined as ≥ four infiltrating mononuclear cells per tubular cross-section). A score for the degree of tubulitis was calculated for each animal, where each normal tubule received a score of 0, mild tubulitis was assigned a value of 1, and the number of tubules with moderate and severe tubulitis was multiplied by 2 or 3, respectively. The total tubulitis score for each animal was the sum of these figures.
Sections were stained for Foxp3 (NB100-39002, Novus Biologicals USA, CO, USA) and counterstained with hematoxylin to assess Foxp3 positive cell infiltration. Quantification was performed by scoring the number of positive cells in five high-power fields per animal using a digital image analysis program. The mean of these scores represented the score for each animal. The images were captured using a microscope (BZ-X810, KEYENCE, Osaka, Japan) and analyzed on the HALO Image Analysis Platform (Indica Labs, NM, USA).
Data analysis
Data are expressed as the mean ± standard deviation, and the Student’s t-test was used to analyze continuous variables. A p-value < 0.05 was considered statistically significant. All statistical analyses were conducted using JMP Pro software (version 17, SAS Institute Inc., Cary, NC, USA) and GraphPad Prism 7.03.
- The Renal Warrior Project. Join Now
- Source: https://www.nature.com/articles/s41598-024-64771-5
