Mouse strains and procedures
This research was conducted in strict accordance with the guidelines and regulations for the care and use of laboratory animals as set forth by the Institutional Animal Care and Use Committee (IACUC) at Yale University. All experimental protocols involving animals were reviewed and approved by the IACUC. Efforts were made to minimize animal suffering and to reduce the number of animals used.
Following strains of mice were used in this study: Pkd1fl 41, Pkd2fl 79, Kif3afl 80, Pax8rtTA (JAX Strain # 007176), TetOCre (JAX Strain # 006234), Tulp3fl 20 (kindly provided by Karel Liem, Yale University), Pkd2+/− 81, Pkd2WS25 55, Ift88fl (JAX Strain # 022409)82, Glis2−/− 50, UBCCre-ERT2 (JAX Strain # 008085), Pkhd1Cre 83, ACTBCre (JAX Strain # 003376), ACTBFlp (JAX Strain # 005703), ROSAmT/mG (JAX Strain # 007676), R26Rpl10a (JAX Strain # 024750). Glis2fl mice were produced in this study. Three Glis2-targeted Glis2tm1a(EUCOMM)Hmgu embryonic stem (ES) cell lines (HEPD0539_2_B10; HEPD0539_2_D09; HEPD0539_2_G11) were obtained from the European Mouse Mutant Cell Repository (EuMMCR, Munich, Germany). All three ES cell lines have identically targeted Glis2, which in its final form has exon 3 is flanked by loxP sites. Two ES cell clones (HEPD0539_2_B10, HEPD0539_2_D09) were expanded and injected into blastocysts to obtain founders. F1 progeny with the Glis2 targeted allele were crossed with ACTBFLP mice to remove the LacZ-neomycin cassette through the germline. An exon 3 deleted Glis2ΔEx3- null allele was obtained from Glis2fl by mating with ACTBCre. Mating strategies for allele combination and doxycycline and tamoxifen Cre induction protocols have been previously described19,36. All strains were backcrossed at least four generations with C57BL/6J and are expected to be at least 90% congenic C57BL/6J. Mice of both sexes were used. All animals were maintained in secure, intact, clean, fully assembled, barcoded, static micro-isolator cages. Temperature was maintained between 20 °C and 26.1 °C and humidity between 30% and 70%, with 12 h:12 h light:dark cycles. All animals were used in accordance with scientific, humane, and ethical principles and in compliance with regulations approved by the Yale University Institutional Animal Care and Use Committee (IACUC). Genotyping was done on DNA isolated from toe clips. Mice were euthanized according to standard protocols approved by Yale IACUC. Experimental mice were euthanized with ketamine (100 mg/kg) and xylazine (10 mg/kg). Blood was collected by ventricular puncture. One kidney was snap-frozen for protein and mRNA extraction, and the other kidney was fixed in situ by perfusion through the heart with 4% paraformaldehyde (PFA, MP Biomedicals, Cat. no. 0215014601) in 1× PBS. Sera were separated using Plasma Separator Tubes with lithium heparin (BD Biosciences, BD Vacutainer, Cat. No. 364606). Serum urea nitrogen was analyzed by the George M. O’Brien Kidney Center at Yale. Genotyping primer sequences are provided in Supplementary Data 5.
Copy number determination of Pax8rtTA and TetOCre
Mouse genomic DNA was diluted to 50 ng/μl and mixed with iTaq Universal SYBR Green Supermix (BioRad, Cat. no. 1725121) and qPCR primers specific to Pax8rtTA or TetOCre and 18S rRNA. The primer sequences used were:
Pax8E1QF15’-GGGAAGAGAAGGGTTGAAGG-3’
Pax8E1QR15’-ACTCAGCAGGCCAGGAAGTA-3’
TetCreQF25’-CACGCTGTTTTGACCTCCAT-3’
TetCreQR25’-CTCTGCCCCTCGACTCTAGA-3’
qPCR was performed with a CFX96 Touch Real-Time PCR Detection System (BioRad). The expression of Pax8rtTA and TetOCre was normalized to 18S by the 2−ΔΔCT method.
Pkd1 deletion efficiency in kidney tissues
Mice were euthanized and one kidney was snap-frozen in liquid nitrogen. DNA was extracted with DNeasy Blood & Tissue kit (Qiagen, Cat. no. 69504). DNA concentration was measured by Nanodrop 2000 (Thermo Fisher Scientific, Cat. no. ND2000). An equal starting amount of DNA (50 ng/μl) was used for all samples. A common forward primer (Pkd1X1F1) was designed to the region upstream of the first loxP site within intron 1. A reverse primer (Pkd1X1R1) was designed to the region immediately downstream of the first loxP site also within intron 1. A second reverse primer (Pkd1X2R4) was designed to the region downstream of the second loxP site within intron 4. The following primer were used in Pkd1 deletion efficiency assay:
Pkd1X1F1: 5’-TCACGGAAGAGCAGCCTGCCTT-3’
Pkd1X1R1: 5’-TCTGTGTACTGGGGCACAGCCT-3’
Pkd1X2R4: 5’-AGCACCTGAGCTGTTGTCAGGG-3’
Cre activation results in deletion of exons 2 to 4 of Pkd1. The product from primer set Pkd1X1F1/ Pkd1X1R1 yields a 119 bp PCR in wild type (no loxP) DNA and a 319 bp in the undeleted loxP allele. Pkd1X1F1/ Pkd1X2R4 will result in a PCR product of 425 bp only obtained after Cre mediated recombination. The PCR products were resolved on a 1.5% (w/v) agarose gel (Sigma-Aldrich, Cat. no. A9539), imaged with ChemiDoc XRS+ Imaging System (BioRad, Cat. No. 1708265) and the intensity of the PCR bands in captured TIFF images were quantitated using ImageJ (NIH). A ratio of the densitometric intensity of the loxP-deleted 425 bp band to the sum of the densitometric intensities of the loxP-undeleted 319 bp band plus the deleted 425 bp band was taken as indicating the deletion efficiency for each sample.
Translating ribosome affinity purification (TRAP)
TRAP was performed largely by the method described by62 with a few modifications. Briefly, fresh kidney in lysis buffer [20 mM HEPES-KOH (Fisher Scientific, Cat. no. AAJ16924AE), 5 mM MgCl2 (Thermo Fisher Scientific, Cat. no. AM9530G), 150 mM KCl (Thermo Fisher Scientific, Cat. no. AM9640G), 0.5 mM DTT (AmericanBio, Cat. no. AB00490-00005), Mini Complete EDTA-Free Protease inhibitor (Roche, Cat. no. 11873580001), 100 µg/ml Cycloheximide (Sigma-Aldrich, Cat. no. C7698), 40 U/ml RNasin Plus Ribonuclease Inhibitor (Promega, Cat. no. N2615), and 20 U/ml SUPERase•In RNase Inhibitor (Thermo Fisher Scientific, Cat. no. AM2696)] was homogenized using a bead mill homogenizer (Precellys® evolution, Bertin Instruments) at 5500 rpm for 20 s twice with 1 min ice-bath in between. The homogenate was then centrifuged at 2000 × g at 4 °C for 10 min and the soluble fraction was mixed with 10% NP-40 (Thermo Fisher Scientific, Cat. no. 28324) prior centrifugation at 20,000 × g at 4 °C for 10 min. The supernatants of the homogenates were mixed with anti-GFP monoclonal antibodies (Monoclonal Antibody Core Facility, Memorial Sloan-Kettering Cancer Center, New York, Cat. no. Clone: 19C8 and 19F7) pre-conjugated to magnetic beads (Dynabeads MyOne Streptavidin T1, Thermo Fisher Scientific, Cat. no. 65601) for overnight immunoprecipitation at 4 °C with gentle rotation. The magnet bound fraction was washed three times with 1 M KCl buffer containing 20 mM HEPES-KOH (pH 7.4), 5 mM MgCl2, 1 M KCl, 1% NP-40, 0.5 mM DTT and 100 µg/ml Cycloheximide. Any residual DNA was removed with DNase I digestion (Qiagen, Cat. no. 79254) and RNA was isolated with RNeasy MinElute columns (Qiagen, Cat. no. 74204). The RNA eluted in RNase-free water were stored at -80oC until sequencing. mRNA library preparation and sequencing were performed by the Yale Center for Genome Analysis. The sequencing library was prepared using the ribosomal depletion method (KAPA RNA HyperPrep Kit with RiboErase, Roche) and sequencing was run on Illumina’s NovaSeq 6000 platform using 150 bp paired end reads with read depth 100 million reads per sample.
TRAP RNASeq analysis
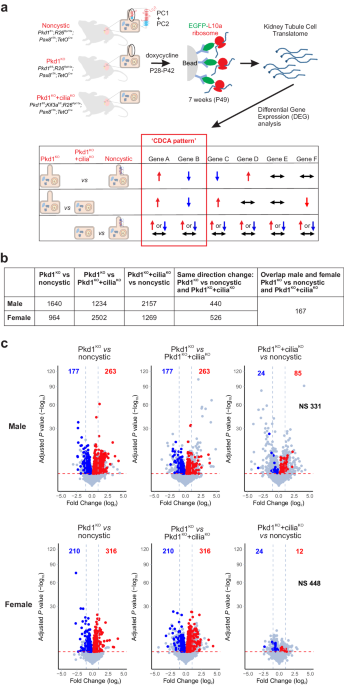
Raw TRAPSeq fastq files were processed using fastq tool (version 0.20.0)84. Sequencing reads with low-quality bases were trimmed or filtered with the default settings. Cleaned reads were aligned using STAR (version 2.7.9)85 with the mouse reference genome gencode version GRCm38.p6 with vM25 gene annotation. Expression quantification for aligned reads was performed using featureCounts (version 2.0.0)86. We used an expression threshold of ≥6 read counts in at least 20% of samples for each sex; genes not meeting this expression threshold were eliminated from downstream analyses. The filtered read counts matrix was normalized by the transcripts per million (TPM) method. Detection of differentially expressed genes was performed using R package DESeq2 (version 1.30.1)87 and the Benjamini–Hochberg procedure was used for multiple test correction with FDR ≤ 0.05 used as the significance threshold for detection of differentially expressed genes (DEG). The DEGs in the Pkd1KO mutant that when compared to the noncystic and Pkd1KO+ciliaKO have the same change direction were defined as “CDCA pattern” DEGs. Heatmaps were generated using the “pheatmap” package in R, with genes and samples hierarchically clustered using the Pearson correlation method. For the heatmaps generated from microdissected kidney tubule bulk RNASeq data31, CDCA pattern genes were first ranked based on how many of the 14 microdissected tubule segments showed expression TPM > 1.0, and then further sorted by their significance level (adjusted p value) in the comparison between Pkd1KO and noncystic male samples. The analysis pipeline scripts are available at: https://github.com/StefanSomloLab/TRAPseq.
Primary cell culture
Primary cells from kidney were isolated using enzymatic digestion procedures. Briefly, adult mouse kidney tissue was collected and minced into small pieces maintaining sterile conditions. Minced tissue pieces were transferred to GentleMACS C-tube (Miltenyi Biotech, Cat. no. 130093237) containing 5 ml of freshly prepared dissociation buffer (DMEM containing D, P, A, Y enzymes). The C-tube was inserted into GentleMACS Octo-Dissociator (Miltenyi Biotech, Cat. no. 130096427) and run with pre-set program “37 multi E 01” (run time of 30 mins). After cell dissociation, 5 ml of DMEM with 10% FBS was added to stop digestion, and the mixture was passed through 70 µm strainer followed by centrifugation at 400 × g for 10 min. The cell pellet was resuspended in REGM medium (Lonza, REGM Renal Epithelial Cell Growth Medium BulletKit, Cat. no. cc-3190) and cells were directly seeded for experiments. Cells were let attach for 48 h and then treated with doxycycline (Sigma, Cat. no. D9891-100G) 1 µg/ml for 72 h, followed by serum starvation in 0.1% FBS containing media for 24 h prior to preparation of protein or RNA. For quality control purposes, cells were seeded in parallel, treated similarly to experimental conditions and tested to assess Cre dependent deletion by genotyping after doxycycline treatment. All experiments were done with freshly isolated primary cells without passaging. This reduced the chance of increasing fibroblast overgrowth in the culture. Fibroblast overgrowth was observed in passaged primary cells. Epithelial composition of isolated primary cells was tested by immunofluorescence for epithelial, fibroblasts markers and lineage markers, e.g., ZO1, COL1A1, PAX2 and PAX8.
Cell lines
Cell line generation from primary cells was performed using lentivirus of SV40 large T antigen (Gentarget, Cat. no. LVP016-Hygro). Hygromycin antibiotic was used for selection of the transduced and transformed cells. Cell lines were validated by genotyping and by protein analysis for target alleles. IMCD3 cells (ATCC CRL-2123) were cultured in DMEM/F12 (Thermo Fisher Scientific, Cat. no. 10565042) with 5% FBS. IMCD3-3F5, 3F6 Pkd1 KO clones and the Cas9 parental line have been described previously49. IMCD3 cells were transduced with lentiviruses containing Glis2-EGFP or Glis3-EGFP to generate stable cells. HEK293T (ATCC CRL-3216) were cultured in DMEM high glucose (Thermo Fisher Scientific, Cat. no. 11965092) with 10% FBS. Cells were either transiently transfected with indicated plasmids or stable expression was performed using lentiviruses of the indicated constructs and appropriate selection antibiotic. All cell lines were serum starved 24 h in 0.1% FBS media prior experimentation.
Generation of anti-Glis2 antibodies
Anti-Glis2 antibodies (named YNG2) were custom synthesized by Covance (now Labcorp Drug Development, NC, USA). Two rabbits were injected with 500 µg of each of two peptides corresponding to amino acids 31-46 and 462-476 of the mouse Glis2 sequence (NCBI Accession NP_112461) followed by three rounds of boosting. Serum was collected after final boost and antibodies were obtained from the pooled serum by peptide antigen affinity purification.
Plasmids, transient transfection, and lentiviral infection
Mouse Glis2 (NCBI Accession NM_031184) was cloned into several vectors with different epitope tag combinations: pLenti CMV GFP Blast (Addgene, Cat. no. #17445) with N-terminal V5 tag and C-terminal EGFP tag; pLVX-TetOne (Takara, Cat. no. 631846) with C-term FLAG tag; pHTC HaloTag® CMV-neo was used to clone Glis2 with C-term Halo tag. Human GLIS2 (NCBI Accession NM_032575) was purchased as GLIS2-HaloTag® human ORF in pFN21A (Promega, Cat. no. FHC03277). Mouse Glis3 (NCBI Accession NM_175459) was cloned into pLenti CMV GFP Blast with C-term EGFP tag. The cilia marker Nphp3(1-200)-mApple was made by amplifying a fragment corresponding to amino acid 1-200 of mouse Nphp3 (NCBI Accession NM_028721.3) from mouse kidney cDNA and combining it in-frame with mApple using PCR, followed by subcloning into a pCDH-Hygro vector which was modified from pCDH-EF1-MCS-IRES-Puro (System Biosciences). All constructs were validated by sequencing and immunoblot expression analysis. Transient transfection of HEK293T cells was done with Lipofectamine 2000 (Thermo Fisher Scientific, Cat. no. 11668030). Stable gene expression was achieved using lentivirus transduction and selection with appropriate antibiotic.
Protein preparation, electrophoresis and immunoblotting
Total lysates from cell pellets or tissues were prepared for immunoblotting using 1x Red Loading Buffer Pack (Cell Signal Technology, Cat. no. 7723S) according to manufacturer’s instructions. Briefly, cell pellets or tissue were suspended in the buffer without DTT and sonicated three times, each in 10 pulses of 1–2 s, with a probe sonicator (Misonix, XL-2000; power setting 6). Protein amounts were quantified using a bicinchoninic acid assay (BCA) kit (Thermo Fisher Scientific, Cat. no. 23225). DTT was added to normalized concentrations of protein and samples were boiled for 5 min prior to SDS-PAGE. Fractionation of cells or tissue into cytosolic and nuclear parts was done using either NE-PER™ Nuclear and Cytoplasmic Extraction Reagents (Thermo, Cat. no. 78833) with manufacturer’s instructions or by a non-kit method. For the latter, cells pellets were resuspended in ice cold lysis buffer containing 100 mM Tris pH 7.4, 20 mM NaCl, 10 mM EDTA, 0.1% Triton X-100 and incubated on ice for 5 min. For fractionation of tissues, tissue in the same lysis buffer was homogenized in a bead mill homogenizer (Precellys® evolution, Bertin Instruments) at 6800 rpm for 30 s twice with 1 min ice-bath in between. Cell or tissue lysates were resuspended and centrifuged at 21,000 × g for 5 min. The supernatant was transferred to a new tube and comprised the cytosolic fraction. The pellet was resuspended in 1X Red Loading buffer and followed the protein extraction steps described above.
Lysates were run on 4–20% Mini-PROTEAN TGS Precast Protein gels (Biorad, Cat. no. 4561094) for all except for PC1 western blots. PC1 western blots were run on NuPAGE 3-8% Tris-Acetate 1.5 mm Mini Protein gels (Thermo Fisher Scientific, Cat. no. EA0378BOX). Proteins were transferred either on Nitrocellulose membrane (Biorad, Cat. no. 1620115) or PVDF membrane (Biorad, Cat. no. 1620177). Precision Plus Protein™ Dual Color Standards (Biorad, Cat. no. 1610374) or PureView Prestained Protein Ladder (Azura Genomics, Cat. no. AZ-1142-2) were used as size markers. Ponceau S (SCBT, Cat. no. sc-301558) was used to reversibly stain membranes to determine loading and proper transfer from the gel to the membrane. Membrane stripping for re-probing was done using Restore PLUS Western Blot Stripping Buffer (Thermo Fisher Scientific, Cat. no. 46430). Briefly, membranes were washed with running water multiple times. Then, membranes were incubated with buffer enough to cover the membrane at 55 °C for 10 min followed by washing with running water multiple times. Membranes were then blocked with 5% non-fat dry milk for 10 min, followed by incubation with primary and secondary antibodies. Chemiluminescent signals from membranes were determined using either Clarity Western ECL Substrate (Biorad, Cat. no. 1705060) or SuperSignal Femto Maximum Sensitivity Substrate (Thermo Scientific, Cat. no. 34095) on Licor Odyssey Fc. A detailed listing of antibodies used is provided in Supplementary Data 5.
RNA isolation and qRT-PCR
Total RNA from kidney and cells was isolated using either RNeasy Mini Kit (Qiagen, Cat. no. 74104) or Trizol (Themo Fisher Scientific, Cat. no. 15596026) based method followed by column purification. Cells were serum starved overnight before the day of RNA preparation. For tissue homogenization, kidneys were homogenized in Trizol by bead mill homogenizer (Precellys® Evolution, Bertin Instruments) at 6800 rpm for 30 s twice with 30 s in ice-bath in between. Two µg of total RNA was used for cDNA synthesis using iScript cDNA synthesis kit (Biorad, Cat. no. 1708890). Quantitative RT-PCR was performed using iTaq Universal SYBR green Supermix (Biorad, Cat. no. 18064022) or AzuraView Green Fast qPCR Blue Mix, LoRox (Azura Genomics, Cat. no. AZ2320) in CFX96 Touch Real-Time PCR detection system (Biorad, USA). Gapdh or 18s was used for normalization. qRT-PCR primer sequences are provided in Supplementary Data 5.
Immunocytochemistry and cystic index measurement
Immunocytochemistry was performed on primary cells, IMCD3 and HEK293T as per standard protocols. Cells were plated on 4-well chambered dishes (Cellvis, Cat. no. C4-1.5P). All adhered cells were washed gently two times with 1X PBS followed by fixation with 4% PFA in PBS for 20 min. Cells were washed 3 times with 1X PBS and permeabilized with 0.25% Triton X-100 for 5 min followed by blocking with 5% BSA in PBS. Primary antibody was diluted in 5% BSA and incubated at room temperature for 1 h. Cells were washed 3 times with PBS followed by secondary antibody in 5% BSA for 1 h at room temperature. Cells were washed another 3 times with PBS and Hoechst was added to stain nuclei. Microscopy of non-fixed live cells was done on adhered cells. Cells were washed in sterile conditions in 1X PBS and imaging was done on cells with 1X PBS to reduce autofluorescence from media. All images were acquired on Nikon Eclipse Ti (Nikon Instruments Inc, Japan) equipped with Yokogawa CSU-W1 spinning disc and Andor lasers (Andor Technology, UK). For movies, gamma correction was done to reduce background noise. For tissue immunohistochemistry, cryosections (5–7 μm) were used according to standard procedures. Cystic index was calculated as previously described19 using frontal plane sections of kidneys processed for hematoxylin and eosin and scanned by light microscopy under the control of MetaMorph software (Universal Imaging, version 7.7).
Blood urea nitrogen (BUN) measurements
BUN was measured at the George M. O’Brien Kidney Center at Yale Core using Stanbio Urea Nitrogen (BUN) Procedure 0580 quantitative colorimetric determination of urea nitrogen in serum and plasma. The method is based on the diacetylmonoxime (DAM) methodology. Samples were read on the Excel Chemistry Analyzer (Stanbio Laboratory, Boerne Texas).
Proliferation assays
Proliferation was measured by EdU incorporation and Ki67 staining. For EdU incorporation, mice received 50 mg/kg of 5-ethynyl-2’-deoxyuridine (Invitrogen, Cat. no. A10044) by intraperitoneal injection 4 h before euthanasia. Kidneys were fixed with 4% PFA overnight and embedded in OCT after 30% sucrose infiltration and processed for immunofluorescence. EdU staining was performed with Click-iT™ EdU Imaging Kit with Alexa Fluor™ 647 (Invitrogen, Cat. no. C10086,). KI-67 expression in kidney was detected with rabbit anti-Ki67 antibody (Thermo Fisher Scientific, RM-9106-S1, dilution 1:200). Numbers of EdU and Ki67-positive nuclei were counted amongst at least 1,000 DBA or LTA positive cells per animal.
Senescence associated-β-Galactosidase (SA-β-Gal) staining in tissue
SA-β-Gal staining was done using the Senescence β-Galactosidase Staining Kit (Cell Signaling, Cat. no. 9860), adapted for tissue, according to manufacturer’s instructions. Briefly, kidneys were collected after perfusing mice with 4% PFA in 1x PBS followed by fixation in 4% PFA at 4 °C overnight. Following fixation, kidneys were treated with 30% sucrose solution in 1x PBS at 4 °C overnight and embedded in OCT compound. Frozen sections (5–7 μm) were air dried for 15 min and washed with 1x PBS three times, then incubated with fresh SA-β-Gal staining solution at 37 °C for 24 h. Sections were counterstained with Nuclear Fast Red solution (Statlab Medical Products, Cat. no. STNFR100).
RNAScope multiplex fluorescent in situ hybridization (RNAScope-FISH)
RNAScope® Multiplex Fluorescent Kit v2 (Advanced Cell Diagnostics) was used to perform RNA-probe based fluorescent in situ hybridization (FISH) according to the manufacturer’s instructions. Briefly, 5–7 µm thick Tissue-Tek OCT Compound (Sakura, Cat. no. 4583) embedded cryosections of mouse kidneys were fixed in 4% PFA for 15 mins at 4 °C prior to serial dehydration for 5 min each with 50, 70 and 100% ethanol. Sections were then treated with hydrogen peroxide for 10 min at room temperature, followed by incubation in RNAscope target retrieval solution for 15 min at 98–102 °C and then treated with RNAscope Protease III for 30 min at 40 °C. RNA-specific probes targeting mouse Glis2 (Mm-Glis2, Cat. no. 405621) and mouse megalin (Mm-Lrp2, Cat. no. 425881; Advance Cell Diagnostics Inc., USA) were incubated for 2 h at 40 °C. Sections were counterstained with DAPI, and mounted with fluorescent mounting media with anti-fading agent DABCO (Fluoro Gel with DABCO, EMS, USA). All the slides were kept at 4 °C prior to image acquisition. Images were obtained using a confocal microscope (Nikon Eclipse Ti, Japan) under the control of NIS-Elements AR 4.30.02 software (Nikon).
Single molecule fluorescence in situ hybridization (smFISH)
Kidneys were removed and fixed in 4% PFA in 1 x PBS for 4 h and subsequently incubated in a 30% sucrose, 4% PFA in 1 x PBS solution at 4 °C overnight with gentle agitation. Fixed kidneys were embedded in Tissue-Tek OCT Compound (Sakura, Cat. no. 4583) and 5 µm thick sections placed onto poly L-lysine coated coverslips. Probe libraries for Glis2 and Lrp2 were designed using the Stellaris FISH Probe Design Software (Biosearch Technologies). Probe sequences are provided in Supplementary Data 5. Probes for Glis2 were coupled to Quasar® 670 Dye and probes for Lrp2 (megalin) were coupled to CAL Fluor® Red 590 Dye. Kidney sections were hybridized with smFISH probe sets based on the Stellaris RNA FISH protocol (Biosearch Technologies). Images were obtained using a confocal microscope (Nikon ECLIPSE Ti, Japan). under the control of NIS-Elements AR 4.30.02 software (Nikon). A pipeline in CellProfiler88 was written that segmented and identified Megalin puncta, Glis2 puncta and nuclear signal. The intensity of the Glis2 puncta normalized to the number of nuclei were used to calculate signal intensity.
Mouse Glis2 antisense oligonucleotide (Glis2 ASO) development, characterization, and administration
The Glis2 ASOs targeting murine Glis2 were designed, synthesized, and tested in a series of in vitro and in vivo screens and evaluated for efficacy and tolerability in 8–10-week-old male C57BL/6J mice at a dose of 50 mg/kg per week for 3 weeks by Ionis Pharmaceuticals, Inc. (Carlsbad, CA). ASOs that displayed robust reduction of kidney Glis2 mRNA without inducing elevations in plasma transaminases and mRNA biomarkers of renal tubular injury (KIM-1 and NGAL) were selected for additional in vivo studies in models of ADPKD. The Glis2 ASO identified from the screening exercise evaluated in the disease models had the following sequence: 5’- CCTTATAAGCTTCTGC -3’, with the underlined sequences indicated the 2’,4’-constrained ethyl-D-ribose (cEt) modified bases. Additionally, a control ASO was used: 5’- ACGATAACGGTCAGTA. ASO was dissolved and diluted in sterile D-PBS and sterilized by filtration through a 0.22 µm filter. ASO was administered by intraperitoneal injection (IP) at a dose of 50 mg/kg beginning at 5 weeks of age following the end of tamoxifen induction (P28-P35). ASO was administered twice during week 5 (initial week), and once a week from 6 weeks of age through 18 weeks age. Mice were euthanized 1 day after the final dose.
Sample size and statistics
Sample size and power calculations were performed prospectively using STPLAN (v.4.5; University of Texas MD Anderson Cancer Center). Calculations were based on the following inputs: we selected a significance level (α) as 0.05 (one sided) and 0.80 power (1 − β) as our threshold. For kidney weight to body weight ratio in Pkd1fl/fl;Pax8rtTA;TetOCre mice at age 18 weeks after receiving oral doxycycline from P28-42, a mean of 10.2% with s.d. ±3.3% was empirically derived from our earlier data. Our alternative hypothesis was that Glis2fl/fl;Pkd1fl/fl;Pax8rtTA;TetOCre mice would result in at least a 40% decrease in the kidney weight to body weight ratio. Under these expectations, 6 mice could achieve 80% power to detect the difference between the null hypothesis and the alternative hypothesis. For kidney weight to body weight ratio in Pkd1fl/fl;UBCCreERT2 mice at age 18 weeks after receiving tamoxifen from P28-35, a mean of 6.2% with s.d. ±3.0% was empirically derived from our earlier data. Our alternative hypothesis was that Pkd1fl/fl;UBCCreERT2+Glis2-ASO mice would result in at least a 40% decrease in the kidney weight to body weight ratio. Under these expectations, 11 mice could achieve 80% power to detect the difference between the null hypothesis and the alternative hypothesis.
Most of the quantitative data were analyzed using one-way analysis of variance (ANOVA) followed by Tukey’s multiple-comparison test using GraphPad Prism 9.5.1 software. The data of Fig. 3d, f, h were analyzed using two-tailed, unpaired Student’s t test. The data in Supplementary Fig. 5a were analyzed using two-way ANOVA followed by Dunnett’s multiple-comparison test. All data are presented as mean ± s.e.m. p < 0.05 was considered the threshold for significance throughout. Exact p values are provided for all p > 0.0001.
- The Renal Warrior Project. Join Now
- Source: https://www.nature.com/articles/s41467-024-48025-6