Study population
Hemodialysis patients were included as part of the “rISk strAtification in end-stage Renal disease” (ISAR) study (ClinicalTrials.gov: NCT01152892)14. A detailed description of the cohort, including the retinal vessel analysis subcohort has already been published in our previous reports9,13. Inclusion criteria for patients were current hemodialysis treatment for more than 90 days, age at least 18 years and written and informed consent. Exclusion criteria were malignant disease, current infection, pregnancy and lack of written consent. The patients were recruited in dialysis centers in the greater Munich area.
Inclusion criterion for healthy individuals was age of at least 18 years. Exclusion criteria were chronic or acute kidney disease, diabetes mellitus, heart failure, coronary heart disease including myocardial infarction, transient ischemic attack, history of stroke, cardiac valve dysfunction, untreated arterial hypertension, current infection, chronic infectious diseases (HIV, hepatitis, tuberculosis), epilepsy, glaucoma, degenerative retinal diseases, pregnancy or lack of written/informed consent. Hyperlipidemia and treated arterial hypertension were not part of the exclusion criteria. However, individuals receiving vasodilators and calcium-channel inhibitors were excluded, because of a potential interaction with dilation of vessels. Healthy individuals were part of a control group for the “Citrate-Acetate Study” (ClinicalTrials.gov: NCT02745340), a single-center study investigating the effect of citrate and acetate containing dialysates of hemodialysis patients on the immune phenotype. However, the hemodialysis patients of the “Citrate-Acetate Study” did not receive retinal vessel analysis and are therefore not included in this publication.
All study participants gave written and informed consent. Both studies were performed in accordance to the standards of the 2013 Helsinki Declaration. Additionally, the studies were approved by the local ethics committee (Ethics Committee of the Klinikum rechts der Isar of the Technical University Munich).
Clinical parameters and comorbidities
Comorbidities and laboratory parameters of hemodialysis patients were assessed as previously described9. Information on age, gender, body mass index, smoking status, comorbidities and medications of the healthy individuals were gathered in interviews on the day of the examination. Potential exclusion criteria were screened beforehand via telephone interviews. Treated arterial hypertension was defined as having at least one antihypertensive medication. Similar to the hemodialysis patients, blood pressure measurements were performed with a Mobil-o-Graph monitor (I.E.M., Germany) before retinal vessel analysis. High-sensitivity C-reactive protein (hsCRP) and interleukin-6 (IL-6) were analyzed as previously described. hsCRP is displayed as mg/dl15.
Retinal vessel analysis
All retinal vessel measurements were performed under the same standardized conditions in a room with reduced brightness after 10 min of rest. In case of the dialysis patients, examination was performed before a midweek hemodialysis session. After pupil dilation with topical tropicamide (0.5% Mydriaticum Stulln, Pharma Stulln, Germany) SVA was performed, followed by DVA. In order to enhance patient compliance, the dominant eye was used, if possible. SVA included a series of photographic images of the retina centered to the optic disc. We used a Static Vessel Analyzer (TRC-NW8, Topcon, Tokyo, Japan) taking images at an angle of 50° from one eye. Afterwards retinal arterial (CRAE) and venous (CRVE) equivalents were calculated using the Paar-Hubbard formula16 with the standardized software VesselMap (V3.60, Imedos Systems, Jena, Germany). CRAE and CRVE were measured in measuring units (MU). One measuring unit of the imaging device represents 1 µm in Gullstrand’s normal eye model. Arterio-venous ratio (AVR) was calculated as CRAE divided by CRVE. Whenever more than one high-quality image was available, mean CRAE, CRVE and AVR were calculated from a maximum of 3 images. Patients or healthy individuals without at least one high-quality photograph were excluded from the analysis.
Shortly after SVA, DVA measurement was performed on the same eye with a Dynamic Vessel Analyzer (Imedos Systems, Jena, Germany). As previously described, diameters of one arteriole and one venule approximately two disc diameters away from the optic disc were continuously measured (Supplementary Video S1)9. 50 s of baseline measurement was followed by three cycles of 20 s lasting flickering light, each intercepted by 80 s of normal light. This amounted to a total measurement time of 350 s. Key parameters of DVA, maximal relative arteriolar dilation in response to flicker (aMax, % to baseline) and maximal relative venular dilation in response to flicker (vMax, % to baseline) were calculated for each study participant as described previously9. Quality of the measurements was graded on a scale from zero to five by the first observer, as previously described17. Whenever the quality score was below 2.5 the measurement was excluded after discussion with a second observer9.
Statistical analysis
Characteristics of patients and healthy individuals are displayed as mean ± standard deviation for normally distributed variables and as median [interquartile range] for variables following a skewed distribution. Student’s t-test was used for comparison between two groups for normal, and Mann–Whitney U test for non-normal data. Categorical data were compared using Chi-square tests (Fig. 1). Correlation analyses were performed with Spearman’s rank correlation coefficient (rho). We performed a case–control matching for age regarding the participants with valid DVA. For participants with valid SVA data a gender and age matching was calculated. As there is no evidence—to our knowledge—for relevant gender-specific differences in DVA, matching was only executed regarding age for the sake of not excluding too many patients/probands. Additionally, gender was not associated with aMax or vMax in a statistically significant fashion in any of the whole or matched DVA subcohorts (healthy and hemodialysis). Case–control matching was performed using fuzzy matching with a tolerance for age matching of 5 years. IBM SPSS Statistics, version 26 (IBM Corporation, Armonk, New York) was used. For visualization in a scatter plot (Fig. 4) and for fitting the linear regression model (Supplementary Table S2) hsCRP was ln-transformed due to the skewed distribution. For graphical demonstration purposes (Fig. 4) a linear regression line was plotted for the univariate relationships between age/hsCRP and DVA parameters aMax and vMax.
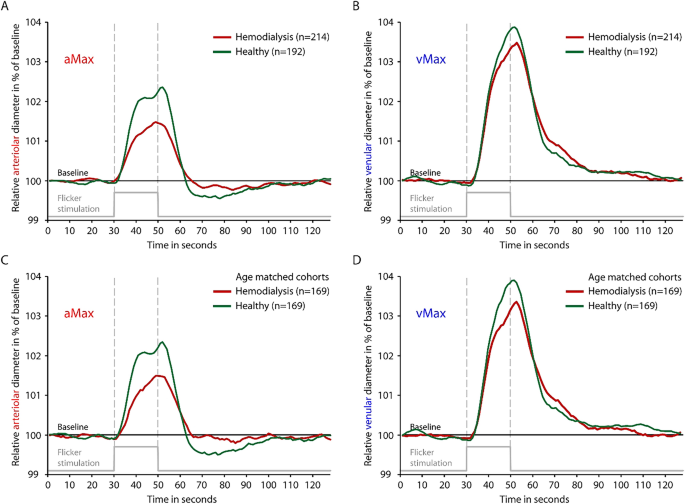
Comparison of time-diameter curves for dialysis patients (red) and healthy individuals (green) for whole cohorts (A,B) and age-matched cohorts (C,D). Maximum arteriolar dilation (aMax; A,C) and maximum venular dilation (vMax; B,D) were determined near the end of the flickering stimulation as previously described. Light grey line on the bottom of each panel indicates time profile of 20 s lasting flickering light stimulation.
- The Renal Warrior Project. Join Now
- Source: https://www.nature.com/articles/s41598-024-64581-9