Characteristics of study samples
Our goal was to uncover robust epigenetic changes associated with common manifestations of kidney disease, such as low kidney function (eGFR) and fibrosis. Diabetes and hypertension associated kidney diseases exhibit overlapping clinical manifestations, and combined account for over 75% of all CKD and end-stage renal disease (ESRD) cases in the US34,35. As the epigenome is cell-type specific, we analyzed changes in microdissected human kidney tubule samples to reduce the contribution of cell heterogeneity36. We collected 399 kidney samples from healthy, diabetic, hypertensive, and diabetic and hypertensive CKD subjects (Table 1). The mean age was 60.2 years. Approximately one-third of the participants had diabetes, and nearly 68% had hypertension. The mean eGFR, calculated by the CKD-EPI formula, was 71.2 ml/min/1.73m2, ranging from 3.7 to 134.9 ml/min/1.73m2. Approximately one-third (n = 123) of the subjects had an eGFR less than 60 ml/min/1.7 2m2, meeting the classic definition of CKD.
We also assessed histological changes in biopsy samples using an unbiased scoring system, evaluated by a pathologist who was blinded to the clinical parameters. The median tubulointerstitial fibrosis (hereinafter referred to as fibrosis) ranged from 0 to 100% with 129 samples with greater than 10% fibrosis. Fibrosis and eGFR showed a significant negative correlation (Pearson correlation coefficient r = −0.46, P < 2.2 ×10⁻¹⁶; Supplementary Fig. 1a). To examine the relatedness of the different clinical and histological variables, we conducted clustering (Supplementary Fig. 1b). Clinical and histological variables separated and formed independent clusters. Variables from independent clusters used in the analysis to prevent model overfitting. In our study, 49 (12%) subjects met the standard definition of DKD, which includes histological changes and reduced eGFR, while 94 (23%) patients had hypertensive CKD.
Epigenome-wide association analysis (EWAS) identified methylation changes associated with kidney structure and function
In this study, we quantified DNA methylation at over 850,000 CpG sites in 399 kidney tubule samples using Illumina Human Methylation EPIC arrays. After rigorous data processing and quality control filtering, we investigated the association between fibrosis and DNA methylation levels at 701,519 CpG sites. To account for technical effects and the bimodal distribution of the methylation measurements, we employed linear mixed-effects models, regressing methylation (used as M values) on bisulfite conversion control, mean intensity of measurements, sample plate, and lymphocytic infiltration. Next, we performed a linear regression analysis to assess the association between normalized fibrosis score and residualized methylation, while controlling for potential confounders such as age, sex, race, hypertension, and diabetes status.
We identified 171 CpG sites where cytosine methylation levels correlated with the degree of fibrosis (differentially methylated position: DMP) (Fig. 1a; Supplementary Data 1) at an epigenome-wide significance level (P < 9.42 × 10⁻⁸) after correcting inflation. Of the 171 fibrosis-DMPs, 49 (28.7%) exhibited lower methylation in fibrotic samples (Fig. 1b). The most significant signal was observed at cg18566594 (on chromosome 12; Bacon corrected P = 1.10 × 10⁻¹¹), which was in the promoter region of CCND2-AS1 gene (Supplementary Fig. 2). Methylation levels at the top fibrosis DMPs, cg04659689 and cg01105362, showed direct and significant correlation with fibrosis score (Fig. 1c).
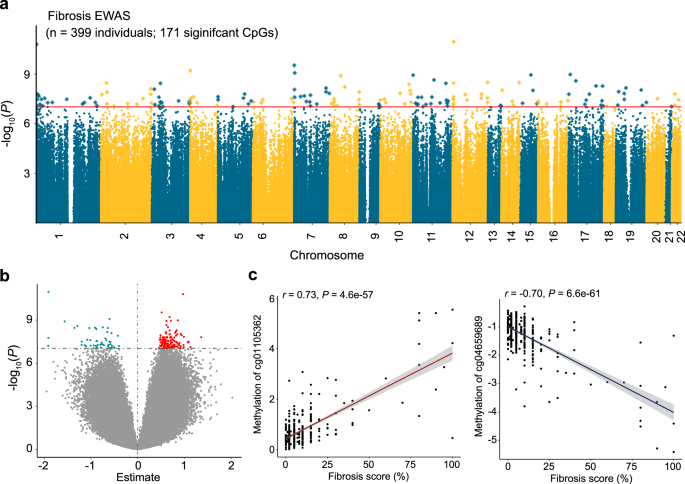
a Manhattan plot of fibrosis EWAS in 399 human kidney samples. The x-axis represents the chromosomal location of the CpG probes and the y-axis is the -log10(P value with Bacon‐correction) of fibrosis and methylation association. The epigenome-wide significance level (two-sided P < 9.42 × 10⁻⁸) is indicated by the red line and significant CpGs are highlighted as rectangles. b Volcano plot showing the association between fibrosis and methylation changes. The x-axis represents the effect size (from the linear regression) of each CpG probe with fibrosis and the y-axis indicates the strength of the association (-log10(P value with Bacon‐correction)). Each dot corresponds to one probe, with red dots representing hypermethylated probes and cyan dots representing hypomethylated probes that are associated with higher fibrosis. c Correlation between methylation levels and fibrosis score at cg04659689 and cg01105362. Each data dot represents one kidney sample. The x-axis shows the percent kidney fibrosis (0–100%),the y-axis represents the methylation level (as M-value), and the shaded area indicates the 95% confidence interval for the correlations. The r represents Pearson’s correlation coefficient and P indicates the strength of the association (two-sided).
Methylation levels at 19 CpG sites showed a statistically significant association with eGFR (eGFR-DMPs) (Supplementary Fig. 3a; Supplementary Data 2) at an epigenome-wide significance threshold. Of the 19 eGFR-DMPs, 15 had lower methylation levels at high eGFR (Supplementary Fig. 3b). The strongest association was obtained at cg27630540 (on chromosome 4; Bacon corrected P = 1.8 × 10⁻⁹), which was in the enhancer region of the UVSSA (UV Stimulated Scaffold Protein A) gene (Supplementary Fig. 3c).
To evaluate the robustness and consistency of the identified methylation changes, we sought to validate the fibrosis-DMPs in two independent external cohorts containing 9137 and 85 human kidney samples obtained from individuals with and without diabetes and analyzed using Illumina Infinium 450 K arrays. The demographic, clinical, and histopathological characteristics of the two validation datasets can be found in Supplementary Data 3 and 4. Owing to differences in methylation platforms (450 K and EPIC or 850 K arrays), we could directly compare 55 out of our 171 identified fibrosis-DMPs in the first validation cohorts38. Overall, the effect estimates of the 55 CpGs in our study strongly and significantly correlated with those described by Gluck et al. (Pearson correlation coefficient r = 0.81, P = 3.8 × 10⁻¹⁴; Supplementary Fig. 4a, Supplementary Data 5)38. For the second validation cohort (containing 85 kidney samples), Ko et al. identified differential methylation regions using a distinct approach that directly compared methylation ratio between control and diseased tubule samples (binary outcome)37. Hence, we rerun the same model using linear regression while adjusting for age, sex, race, diabetes, hypertension, and batch effects to validate the 85 CpG sites out of our 171 identified fibrosis-DMPs which overlap with the second dataset. Similarly, the effect estimates of the 85 CpGs between the two studies were highly consistent (Pearson correlation coefficient r = 0.73, P = 2.0 × 10⁻¹⁵), further validating the association between CpG methylation and kidney disease severity (Supplementary Fig. 4b, Supplementary Data 6).
Lastly, we conducted sensitivity analyses to evaluate the robustness of our findings. Sensitivity analyses additionally adjusting for BMI (n = 370; Supplementary Fig. 5a, b) or genetic ancestry (the top 5 genetic principal components) (n = 378; Supplementary Fig. 5c, d) yielded highly consistent results. Restricting the analysis to participants who had hypertension and/or diabetes (n = 286; Supplementary Fig. 5e, f) also yielded consistent associations. Similar results were observed when we limited the sensitivity analysis for those probes showing significant association in the EWAS analysis. In summary, our analysis identified robust changes in cytosine methylation levels in kidney tissue samples associated with eGFR and fibrosis.
Kidney disease associated cytosine methylation changes are enriched on kidney enhancers
Cytosine methylation changes at transcription factor binding sites could potentially alter the binding strength of transcription factors and decrease gene expression, while methylation in the gene body could increase transcript levels39. We used the Reference Sequence (RefSeq) database to annotate transcribed regions, gene body, 5′ and 3′ untranslated genomic regions to understand the genomic regions showing methylation changes. We observed that the majority of fibrosis DMPs were located in gene body regions (41.5% of DMPs) and regions surrounding the transcription start site (38.0% of DMPs; Fig. 2a).
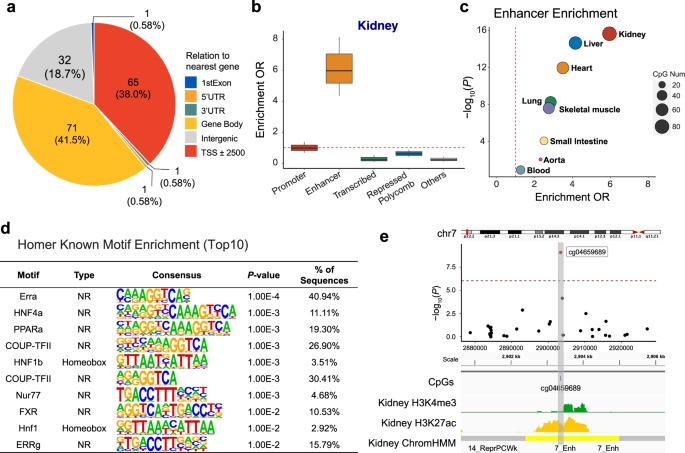
a Genomic features of 171 fibrosis-DMPs mapped to Refseq. b Functional enrichment of fibrosis-DMPs (n = 171) using human kidney chromatin profiling. The fold enrichment of a particular genomic regulatory regions compared to all CpGs present on the EPIC arrays are shown. The x-axis shows genomic annotations and y-axis represents the enrichment odds ratio (two-sided Fisher exact test). Center lines indicate the median fold change, box limits denoted the upper and lower quartiles, and whiskers extend to the 5th and 95th percentiles range. c Tissue specificity of fibrosis-DMPs across 8 different human tissue. The functional annotation is based on (Roadmap project) ChromHMM data. The x-axis shows the enrichment OR and the y-axis shows the P value calculated by a two-sided Fisher exact test; d Transcription factor motif enrichment (based on HOMER) of fibrosis-DMPs. The P value was obtained by binomial test. e Features of the top significant fibrosis-DMPs cg04659689. Regional association (locusZoom) of the cg04659689 CpG site on chr7p22. The x-axis indicates chromosomal position while the y-axis is the strength of the association (log10(P value)) derived from EWAS analysis. The cg19942083 probe is shown as a red dot. The lower panel kidney tissue ChromHMM annotation and histone modification marks by chromatin immunoprecipitation (ChIP)-seq. H3K4me3 marks represent active promoters, while H3K27ac marks indicate active enhancer elements.
To further understand the functional role of DMPs associated with fibrosis, we generated adult human kidney-specific functional gene regulatory regions annotation (promoters and enhancers, etc.) by combining multiple histone chromatin immunoprecipitation data (ChiP-seq) using ChromHMM40. Investigating the chromatin states where fibrosis-associated DMPs were located, we found that compared to all probes present on the EPIC arrays, fibrosis-DMPs showed the strongest enrichment in regions annotated as enhancers in the human kidney (OR = 5.96, χ2 test P < 2.2 ×10⁻¹⁶; Fig. 2b using a two-sided Fisher exact test).
Having observed an enrichment of DMPs on enhancers, we analyzed the association between DMPs and enhancers across different tissue types (including liver, heart, and lung) using the Roadmap Epigenomics ChromHMM annotations41. We found that kidney fibrosis-associated DMPs were enriched in kidney enhancers (P < 2.2 ×10⁻¹⁶; Fig. 2c) compared to other tissue enhancers.
Furthermore, to identify transcription factors whose effects may be potentially influenced by cytosine methylation, we performed transcription factor motif analysis using the HOMER software. Compared to all probes on the EPIC array, fibrosis-DMPs were enriched for 15 transcription factor binding motifs (false discovery rate (FDR) < 0.05; Fig. 2d, Supplementary Data 7), with the most prominent motifs representing ERRA, COUP-TFII, NUR77, and FXR, HNF4A, PPARA, HNF1B. Many of these transcription factors have been shown to regulate cellular metabolism, and some have also been proposed to play a crucial role in kidney disease and fibrosis development42,43,44,45. For instance, we present cg04659689 as an example of one of the top significant fibrosis-DMPs (Bonferroni corrected P = 8.4 × 10⁻¹⁰) located on a kidney enhancer region (Fig. 2e).
In summary, methylation changes associated with kidney disease were enriched at active functional elements in the kidney. These findings imply the functional importance of the identified fibrosis-DMPs.
Disease associated genetic variants often drive observed disease associated methylation changes
One of the key limitations of EWAS studies is that phenotype-associated methylation changes are likely the consequence of the disease process rather than the cause. Genetic variants do not suffer from reverse causation, so we evaluated genetic variants associated with methylation changes. We analyzed human kidney cis-methylation quantitative trait loci (cis-meQTL) to identify CpG sites that are under the influence of genotype variation (Fig. 3a). We examined single-nucleotide polymorphisms (SNPs) within a cis window of ±1 Mb of the 171 fibrosis-DMPs. A total of 549,142 SNPs around these CpG sites were tested (constituting 673,614 SNP–CpG pairs), and 3,825 significant cis-meQTLs were identified (FDR < 0.01 level; Supplementary Data 8). Among the 171 fibrosis-DMPs, 67 CpG sites (39.2%) had at least one genome-wide significant cis-meQTL SNP (Fig. 3b). Significant cis-meQTL SNPs were mostly found within 100 kb of target DMPs (Fig. 3c), and those DMPs were more likely to be enriched in kidney enhancer regions (OR = 6.99, P = 9.0×10⁻¹⁴), overall suggesting that the observed methylation changes are strongly impacted by genetic variations.
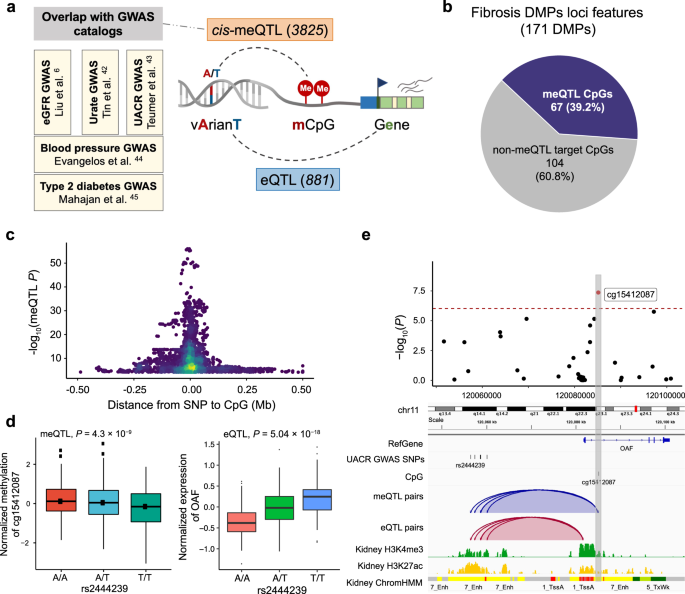
a Integrative analysis to identify methylation and disease-associated genetic variants. Parts of the right panel have been created using BioRender.com. b Genetic variation likely contributes to methylation changes at 40% of fibrosis-DMPs. c Methylation and driving genotype change association. The x-axis is the distance between SNP and their target CpG sites and the y-axis indicates the strength of the meQTL association (-log10(P value)). d The left panel shows the association of genotype (rs2444239, x-axis) and normalized CpG methylation (cg15412087, y-axis) in human kidneys (n = 443). The right panel shows the association of genotype (rs2444239, x-axis) and normalized gene expression (OAF, y-axis) in human kidney tubule samples (n = 356). Each dot represents a sample, which was grouped according to the genotype. Center lines indicate the medians, box limits show the upper and lower quartiles, and whiskers extend to the 5th and 95th percentiles. The P value (two-sided) was derived from either meQTL regression models or published eQTL meta-analysis of 686 samples. e Feature of fibrosis-DMPs cg15412087 and its driving genetic changes (meQTLs). The upper panel shows the regional association of the cg15412087 CpG site on chr11q23. The x-axis indicates chromosomal position while the y-axis is the strength of the association derived from EWAS analysis (-log10(P value)). The cg15412087 probe is shown as a red dot. The lower panel includes meQTLs, eQTLs, human kidney histone modifications, and chromatin states annotations. The top meQTL (rs2444239) selected based on the P value of meQTL associations is highlighted by the label.
To understand whether the underlying genetic variation-driven methylation changes may be associated with disease development, we overlapped genetic variants that drove methylation differences (3,825 cis-meQTLs) with genetic variants associated with phenotype development (GWAS) (Supplementary Data 9). We identified 43 cis-meQTLs (6 CpG) associated with eGFR GWAS6, 23 cis-meQTLs (3 CpG) associated with urate GWAS46, and 7 cis-meQTLs (1 CpG) associated with UACR GWAS47. Furthermore, by mapping to additional disease-associated GWAS results, we found 9 cis-meQTLs (6 DMP) associated with blood pressure and 32 cis-meQTLs (3 DMPs) associated with T2DM48,49.
Finally, to understand the target genes of genotype-associated methylation changes, we examined gene expression changes driven by genetic variations, in expression quantitative trait loci (eQTL) analysis6. We found that from the methylation-driving SNPs, 881 unique SNPs showed statistically significant associations with 53 genes, including FBRSL1, OAF, LIMK1, TRIM29, and PXMP2 (Supplementary Data 10). For instance, rs2444239, a cis-meQTL associated with DNA methylation at cg15412087, was also associated with albuminuria (measured as urinary albumin creatinine ratio) and exhibited a significant correlation with OAF expression (P = 5.04 × 10⁻¹⁸; Fig. 3d). Cg15412087 was located in the enhancer region of OAF, as indicated by the H3K27Ac ChIP-seq signal and chromatin state annotations (Fig. 3e). OAF (Out At First Homolog), a protein-coding gene expressed in the renal cortex, has been reported to be involved in protein reabsorption in the kidney47. Knockdown of its orthologs in Drosophila nephrocytes reduces albumin endocytosis47. Collectively, our findings indicate that close to a third of kidney disease-associated methylation changes are under genotype influence, and in multiple cases, these underlying genetic variants are also associated with kidney dysfunction. These results suggest that genetic variations play a significant role in driving methylation changes, which in turn can influence disease development.
Changes in human kidney single cell open chromatin regions in disease states
Epigenetic changes are highly cell-type specific, and although bulk methylation differences have been linked to kidney-specific enhancer changes, the underlying cell types have not been identified. To understand cell-type specific epigenetic variations, we reanalyzed single-nucleus transposase-accessible chromatin with sequencing (snATAC-seq) data from 14 human kidney samples50. The snATAC-seq libraries were prepared following the 10x platform and the raw sequencing data were aligned using Cell Ranger ATAC and further analyzed using Signac51. After quality control, a total of 401,395 accessible chromatin regions (also known as ‘ATAC peaks’) were identified in all cell types.
Chromatin accessibility information, which indicates transcriptionally active (i.e., open) and inactive (i.e., condensed) regions, allowed for grouping cells into discrete cell clusters based on differentially accessible chromatin regions (DAR). Using open chromatin-based gene activity indices we were able to identify 24 key kidney cell types, including different types of proximal tubules segments 1-3 (PT_S1, S2, S3, and injured), descending loop of Henle (DLOH), podocytes, cortical and medullary thick ascending loop of Henle (C_TAL and M_TAL), distal convoluted tubule (DCT), connecting tubule (CNT), principal cells of collecting duct (PC), intercalated cells type alpha and beta (IC_A and IC_B), stromal, and different types of immune cells (Fig. 4a; Supplementary Fig. 6a; Supplementary Data 11).
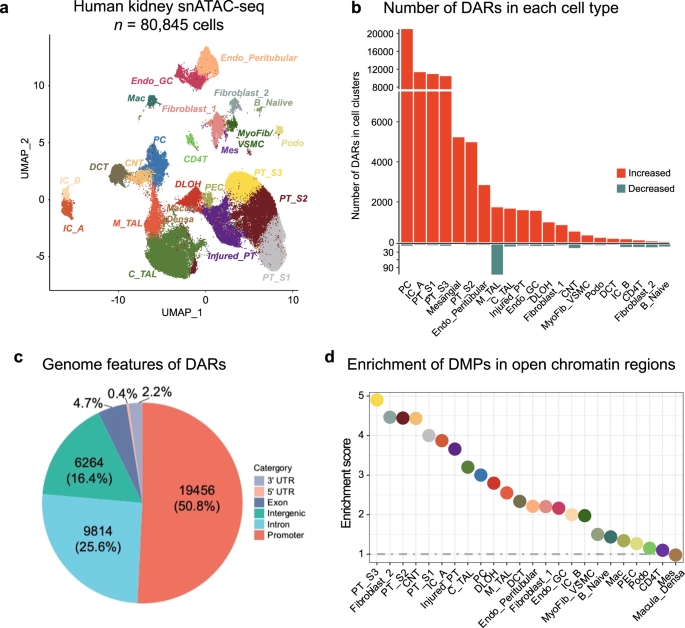
a Single-nucleus accessibility UMAP for 80,845 human kidney cells by snATAC-seq. Each dot represents a cell, with color coding for the cell types: Endo_GC; endothelial cells of glomerular capillary tuft, Endo_peritubular; endothelial cells of peritubular vessels, Mes; meseangial cells, VSMC/Myofib; vascular smooth muscle cells/myofibroblast, PEC; parietal epithelial cells, Podo; podocyte, PT_S1; proximal tubule segment 1, PT_S2; proximal tubule segment 2, PT_S3; proximal tubule segment 3, Injured_PT; injured proximal tubule cells, DLOH; thin descending loop of Henle, C_TAL; cortical thick ascending loop of Henle, M_TAL; medullary thick ascending loop of Henle, DCT; distal convoluted tubule, CNT; connecting tubule cells, PC; principal cells of collecting duct, IC_A; Type alpha intercalated cells, IC_B; Type beta intercalated cells, CD4T; T lymphocytes CD4 +, B_Naiive; Naiive B lymphocyte, Mac; macrophage. b Number of differentially accessible regions (DARs) in each cell type in disease state. The x-axis represents the cell types, while the y-axis indicates the count of significant DARs. The color scale indicates the direction of chromatin accessibility changes compared to control samples, with red indicating increased accessibility and blue indicating decreased accessibility. c The distribution of disease-associated DARs across the RefSeq genome. d Enrichment of fibrosis-DMPs located in cell-types open chromatin regions compared to all CpGs present on the EPIC arrays. The x-axis shows the cell types and y-axis represents the enrichment OR, which was examined using a two-sided Fisher exact test. The color of the dot indicates the specific cell type.
Out of the 14 analyzed samples, 7 can be considered healthy and 7 with CKD based on eGFR and histopathological information (greater than 10% fibrosis). To gain a deeper understanding of cell-type-specific differentially accessible regions (DAR), we compared CKD and control samples, in each cell type. In total, we identified 38,316 cell-specific differentially accessible chromatin regions at a 5% FDR q-value and an absolute log-fold-change threshold of 0.25 (Fig. 4b; Supplementary Data 12). Overall, a higher number of accessible chromatin regions were observed in CKD samples compared to healthy controls. Of the identified differential accessible regions (DARs), the majority (n = 19,456; 50.8%) were located in promoter regions (Fig. 4c; Supplementary Fig. 6b), while a minority (n = 6,264; 16.4%) were intergenic. Notably, identified DARs between healthy and CKD samples highlighted PT, PC, and collecting duct cell types with the highest numbers of DARs. Proximal tubule cells (PT_S1, PT_S2, PT_S3, and injured_PT) had the greatest number of DARs (n = 27,566 in total), followed by the PC (n = 20,684), IC_A (n = 11,154), and mesangial cells (n = 5,114). Amongst the identified DARs, 52.6% (n = 20,157) were cell-type specific (only observed in one cell type) while a subset of DARs (n = 18,159, 47.4%) were shared between cell types.
Disease-associated cell-specific DARs were enriched for distinct transcription factors (the full list of motif enrichment is provided in Supplementary Data 13), including key cell type-specific transcription factors like HNF4A in the proximal tubules. Transcription factors enriched in disease DARs provide insight into cell-specific signaling pathways altered in CKD. Notably, injured PT DARs were significantly enriched for NF1, HNF1B, and FOS motifs (NF1 P = 1.0 × 10−266; HNF1B P = 1.0 × 10−214; FOS P = 1.0 × 10−204), known regulators of PT identity, suggesting that epigenetic regulation may have implications for the development of kidney disease.
For example, our analysis revealed a subgroup of DARs consisting of 24 regions located within or in close proximity to the PRKAG2 gene (protein kinase AMP-activated non-catalytic subunit gamma 2). Notably, these regions exhibited a more accessible chromatin in CKD. PRKAG2 encodes the γ2 regulatory subunit of the AMP-activated protein kinase (AMPK), a crucial regulator involved in glucose and lipid metabolism, ion and water transport, inflammation, and stress response. Additionally, we observed a significant association between rs10224210, a genetic variant identified in eGFR GWAS6, and the expression of the PRKAG2 gene. These findings suggest a potential involvement of the identified DARs in modulating kidney function and kidney disease development.
In summary, our human kidney snATAC analysis identified cell-type and disease-specific changes in open chromatin, some of which were associated with genetic variants known to play a role in disease development, indicating the potential causal role for open chromatin and methylation changes.
The relationship between open chromatin and methylation changes
Next, we wanted to understand the relationship between methylation- (DMPs) and single-cell open chromatin- changes. We found that 145 of the 171 fibrosis-associated DMPs were in open chromatin regions in human kidney single cell data. Fibrosis-DMPs showed enrichment in open chromatin regions in PT, thin descending loop of Henle (DLOH), and principal cells (PC), with the highest enrichment in PT_S3 (OR = 4.90, P < 2.2 × 10⁻¹⁶; Fig. 4d) compared to probes present on the EPIC array. Genomic regions harboring fibrosis-associated DMPs in PT cells were enriched for ERRA, PPARa, RXR, as well as HNF4a transcription factor motifs (the full list of motif enrichment is provided in Supplementary Data 14) again indicating their potential functional importance.
We further overlapped the 171 fibrosis-associated DMPs with cell-specific DARs, and found that approximately one-fifth of DMPs were located in open chromatin regions that changed during disease state; disease-associated DAR regions (n = 53, 31.0%). Most of these regions exhibited a more accessible chromatin status in CKD. Notably, the overlap highlighted PT, PC, and collecting duct cells harboring the highest numbers of DMPs. These regions were enriched for transcription factors motifs including JUND, KLF5, FRA1, JUNB, and ETS: RUNX (the full list of motif enrichment is provided in Supplementary Data 15). These transcription factors were known to regulate cell proliferation, apoptosis, tubulointerstitial inflammation, and fibrosis. These findings further support the potential role of epigenetic alterations in transcriptional regulation and kidney disease development.
The relationship between epigenetic and gene expression changes
Next, we wanted to identify potential target genes for the observed methylation changes. First, we annotated DMPs with the nearest protein-coding gene. Among the 171 fibrosis DMPs, 137 DMPs were annotated to 125 protein-coding genes, including CCND2, SLC25A11, FBRSL1, and KIF15 (Fig. 5a; the full list is provided in Supplementary Data 16). Notably, one of the most significant fibrosis-associated DMP; cg20691282, was annotated to the PERM1 gene (PPARGC1 and ESRR induced regulator, muscle 1 gene), which has been demonstrated to enhance mitochondrial biogenesis and metabolism52.
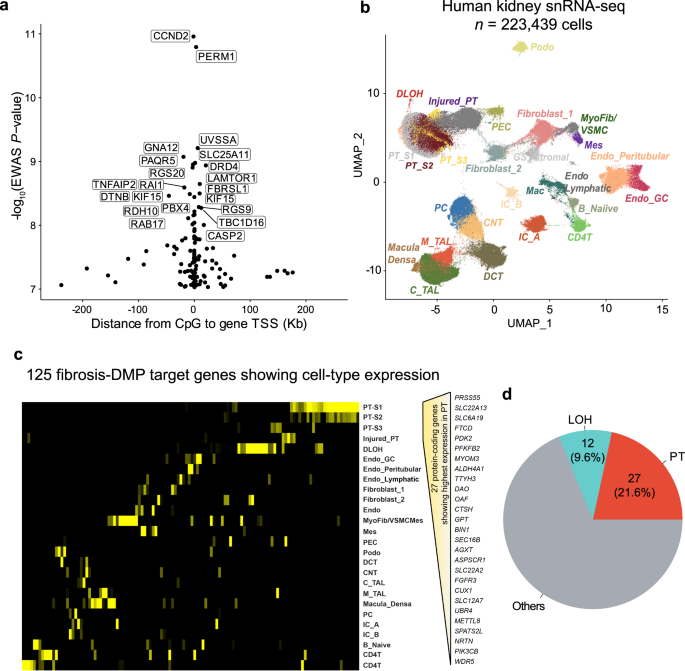
a The location of the prioritized gene promoter in relation to CpG sites. The x-axis is the distance from CpG sites to their target gene TSS and the y-axis is the strength of the association derived from EWAS analysis (-log10(P value)). The prioritized genes of top 20 significant fibrosis-associated DMPs are labeled. b Single-nuclear RNA-seq UMAP of 223,438 human kidney cells. Each dot represents a cell, with color coding for the cell types: Endo_GC; endothelial cells of glomerular capillary tuft, Endo_peritubular; endothelial cells of peritubular vessels, Endo_Lymphatic, endothelial cells of lymphatic vessels, Mes; meseangial cells, VSMC/Myofib; vascular smooth muscle cells/myofibroblast, PEC; parietal epithelial cells, Podo; podocyte, PT_S1; proximal tubule segment 1, PT_S2; proximal tubule segment 2, PT_S3; proximal tubule segment 3, Injured_PT; injured proximal tubule cells, DLOH; thin descending loop of Henle, C_TAL; cortical thick ascending loop of Henle, M_TAL; medullary thick ascending loop of Henle, DCT; distal convoluted tubule, CNT; connecting tubule cells, PC; principal cells of collecting duct, IC_A; Type alpha intercalated cells, IC_B; Type beta intercalated cells, CD4T; T lymphocytes CD4 +, B_Naiive; Naiive B lymphocyte, Mac; macrophage, GS_Stromal; cells specifically present in sclerosed glomeruli. c Heatmap of the expression of 125 co-access genes in each cell type (yellow: high expression, black: low expression); d The number of top 2 cell types expressing the highest fibrosis DMP target genes.
We next aimed to interrogate cell types in which methylation target genes expressed. We reanalyzed gene expression information from 17 adult human kidney samples including 10 control samples and 7 with CKD50. The single-nucleus RNA sequencing (snRNA-seq) libraries were processed using Cellranger (10X Genomics) and analyzed with Seurat. Prior to analysis, doublets were removed using DoubletFinder, and batch effects were corrected using Harmony53,54,55. A total of 223,439 cells passed quality control filters, capturing all major kidney cell types in both healthy and diseased conditions across different anatomical regions (Fig. 5b; Supplementary Fig. 6c).
By analyzing the expression patterns of the 125 targeted genes, we found that the majority of genes exhibited enrichment in the kidney cortex, suggesting that their alterations predominantly affect the function and physiology of this specific region (Fig. 5c). Furthermore, our analysis revealed distinct expression patterns of these genes across different cell types within the kidney, indicating that their dysregulation may be cell type-specific. Interestingly, methylation differences were more common around genes expressed in proximal tubule (PT) cells. Moreover, we found 27 genes (21.6%; Fig. 5d) exhibiting their highest expression in PT cells (PT_S1, PT_S2, PT_S3, and Injured_PT), including those associated with metabolism (e.g., SLC22A13, SLC6A19, FTCD, ALDH4A1, and OAT) and fibrogenesis (e.g., PDK2, PFKFB2, MYOM3). These findings suggest that kidney structure-associated DNA methylation can impact gene expression in various cell types, particularly in PT cells.
Taken together, our results provide valuable insights into the cell-type specificity of DNA methylation changes in kidney disease. They underscore the importance of considering the unique cellular contexts in which these alterations occur, shedding light on the potential mechanisms driving kidney pathophysiology.
Fibrosis-correlating DMPs associated with the expression of solute carriers and metabolic genes
To understand the functional role of genes showing methylation and open chromatin changes in disease, we analyzed the function of the targeted genes. Gene ontology analysis of epigenetically targeted genes revealed 64 biological processes (P < 0.05), such as gluconeogenesis, response to insulin stimulus, and regulation of the MAPK cascade (Fig. 6a; Supplementary Data 17). Impaired renal gluconeogenesis is a key feature of DKD. Reactome pathway enrichment analysis identified 41 pathways (P < 0.05; Supplementary Data 18), including metabolism (such as amino acids and derivatives, glyoxylate, and glucose), transporter-related signaling pathways (such as Na + /Cl- dependent neurotransmitter transporters, bile salts and organic acids, metal ions and amine compounds, and inorganic cations/anions and amino acids/oligopeptides), and gluconeogenesis, as well as MAPK1/MAPK3 signaling. Some of these processes are known to play a role in kidney fibrosis.
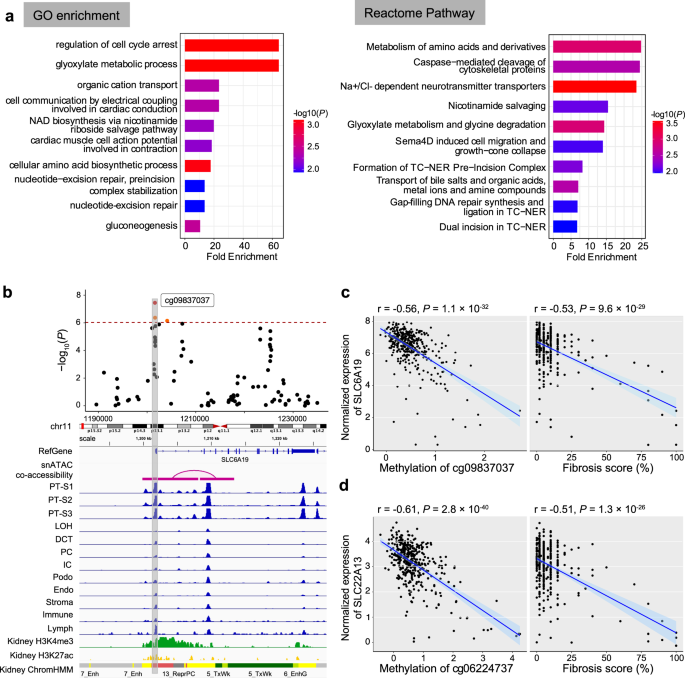
a Functional enrichment of fibrosis-associated DMPs’ nearest genes. The left panel shows Gene Ontology (GO) enrichment, while the right panel depicts the Reactome Pathway enrichment. The top 10 terms passing a nominal P value < 0.05 are shown. The y-axis shows the enriched GO term or Reactome pathways ordered by enrichment scores (x-axis), and the color indicates the strength of enrichment (-log10(P value)) from strongest (red) to lowest (blue). b Feature of fibrosis-DMPs cg09837037 and its prioritized target gene SLC6A19. The upper panel shows the regional association of the cg09837037 CpG site on chr11p15. The x-axis indicates chromosomal position while the y-axis is the strength of the association derived from EWAS analysis (-log10(P value)). The cg09837037 probe is shown as a red dot and highlighted in a box to facilitate mapping across tracks. The lower panel includes Cicero connections, human kidney snATAC-seq chromatin accessibility, histone modifications, and chromatin states. c Left panel: correlation between methylation levels at cg09837037 (x-axis) and SLC6A19 gene expression (y-axis). Right panel: correlation between fibrosis score (x-axis) and SLC6A19 gene expression (y-axis). Each data dot represents one kidney sample. The correlation coefficient and two-sided P value were obtained from the Pearson correlation (r) statistic test. The shaded area indicates the 95% confidence interval for the correlations. d Left panel: correlation between methylation levels at cg06224737 (x-axis) and SLC22A13 gene expression (y-axis). Right panel: correlation between fibrosis score (x-axis) and SLC22A13 gene expression (y-axis). Each data dot represents one kidney sample. The correlation coefficient and two-sided P value were obtained from the Pearson correlation (r) statistic test. The shaded area indicates the 95% confidence interval for the correlations.
Due to the limited number of the targeted genes in this dataset, we expanded gene ontology analysis for the top 1,000 fibrosis-DMPs (829 genes). Gene ontology analysis indicated enrichment for glucose metabolism, potassium ion transportation, as well as regulation of MAPK signaling (Supplementary Fig. 7a). Subsequent pathway enrichment identified 29 pathways (FDR < 0.05; Supplementary Fig. S7b), including amino acid metabolism (such as histidine, tryptophan, and arginine), protein digestion and absorption, gluconeogenesis, cell adhesion, and other metabolic pathways. In summary, we observed that differentially methylated sites in disease showed enrichment for open chromatin regions in kidney proximal tubules and identified multiple genes, mostly solute carriers those methylation changes were not only associated with kidney disease but also with the expression of a variety of transporters.
Here we highlighted the cg09837037 site, which showed strong associations with fibrosis in EWAS analysis. The cg09837037 site was located at the SLC6A19 promoter, which was at an open chromatin region in PT cells (Fig. 6b). Additionally, we observed negative correlations between the methylation level of cg09837037 and SLC6A19 expression (Pearson correlation coefficient r = −0.56, P < 2.2× 10⁻¹⁶; Fig. 6c). Furthermore, SLC6A19 gene expression in human kidneys significantly correlated with fibrosis (r = −0.53, P < 2.2× 10⁻¹⁶). SLC6A19 encodes a sodium-coupled transporter located at the apical membrane of renal proximal tubule cells and is prominently involved in the absorption of neutral amino acids. Mutations in SLC6A19 have been associated with aminoaciduria. Another similar example is the cg06224737 site, located 365 kb from the TSS of the SLC22A13 gene which has been implicated in phosphate and urate reabsorption in human kidney tubules56,57. The methylation level of cg06224737 was found to be negatively correlated with the expression of SLC22A13 (Pearson correlation coefficient r = −0.61, P < 2.2 × 10⁻¹⁶; Fig. 6d). SLC22A13 gene expression in human kidneys was inversely correlated with fibrosis (Pearson correlation coefficient r = −0.51, P < 2.2 × 10⁻¹⁶). In summary, we observed that differentially methylated sites in disease showed enrichment for open chromatin regions in kidney proximal tubules and identified multiple genes, mostly solute carriers, whose methylation changes were not only associated with kidney disease but also with the expression of various transporters.
Methylation risk scores improve kidney function and prognosis estimation
Our analysis indicated that methylation changes offer an important combined read-out for both genetic and non-genetic factors (environmental) and demonstrate an association with disease state. In recent years, genetic factors integrated as polygenic risk scores (PRS) have emerged as powerful tools for predicting diseases. We hypothesized that methylation risk scores (MRS) might work even better than PRS since they integrate both genetic and non-genetic factors. As many of the fibrosis-DMPs were correlated, we applied LASSO regression to narrow down the number of disease-associated CpGs and computed weighted MRS for everyone using a linear combination of the effect estimates and methylation levels of these selected CpGs (Fig. 7a).
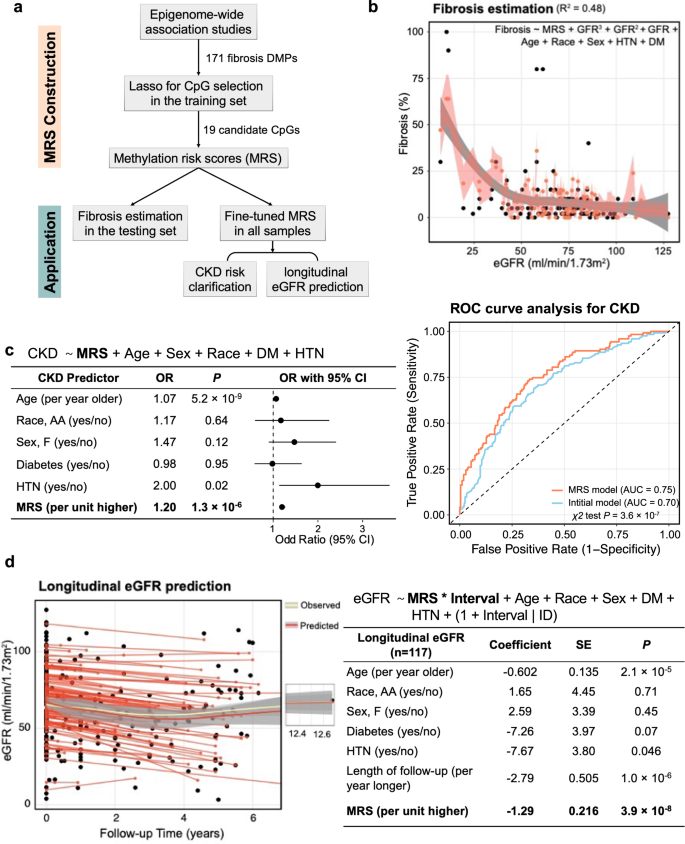
a Schematic representation of the construction and application of the methylation risk score (MRS). The MRS CpG was selected by LASSO models based on the 171 fibrosis DMPs. b MRS-based model estimated fibrosis score. The weighted MRS was computed based on 19 LASSO-selected CpGs from the training set for each individual in the testing set. The model explains 40.2% variance of log2-transformed fibrosis. The black dots represent the observed value and the coral dot indicates MRS-model predict value. The shaded area indicates the 95% confidence interval for the predicted values. c Left panel: MRS independently predicts the incidence of CKD. Right panel: Discriminative performance of MRS predicting incident CKD based on the model only included age, race, gender, DM, and HTN status. Adding MRS provided additional information and improved the discrimination power (area under the curve [AUC] = 0.76 vs 0.70, P = 8.8 × 10⁻⁸). d Left panel: Performance of MRS predicting future kidney function based on the model included age, race, gender, DM, and HTN status (R2 of 0.77). The x-axis represents the follow-up time in years, while the y-axis displays the eGFR values. The yellow curve illustrates the observed overall eGFR change, and the red curve depicts the predicted overall eGFR change pattern. The shaded area indicates the 95% confidence interval for the fitted curve. Right panel: MRS independently predicts future kidney function decline in the follow-up cohort.
First, we wanted to understand whether MRS can improve fibrosis estimates in the kidney. As noted before, eGFR poorly correlates with fibrosis (r of −0.46) and it is hard to estimate the degree of fibrosis based on clinical parameters. We computed a weighted MRS based on 19 LASSO-selected CpGs (Supplementary Data 19) from 70% of the study samples (the training set) for individuals. We used the remaining 30% of the samples as study samples (the testing set). We then generated log2-transformed fibrosis estimates in the testing set using a polynomial linear regression model, with eGFR as the predictor variable, controlling for age, sex, race, diabetes mellitus, and hypertension status. This eGFR-based prediction model explained 30.3% of the log2-transformed fibrosis level variance, consistent with previous studies, indicating that clinical parameters relatively poorly predict histological damage. The addition of MRS into the base model significantly improved this capability to 42.1% (likelihood ratio χ2 test P = 6.3 × 10⁻⁶; Fig. 7b), indicating that the established MRS can enhance the accuracy of fibrosis estimation.
Next, we wanted to know whether MRS can help to identify CKD cases. We fine-tuned the MRS weights using all available 399 samples. We conducted a logistic regression analysis, controlling for age, sex, race, diabetes mellitus, and hypertension status. MRS was significantly associated with CKD incidence (OR = 2.57, 95% CI = 1.37- 4.95; P = 3.6 × 10⁻³; Fig. 7c). Compared to the initial model that only included age, sex, race, presence of DM, and/or HTN, the addition of MRS significantly improved the discriminative performance of incident CKD (area under the curve, 0.76 versus 0.70, likelihood ratio χ2 test P = 1.3 × 10⁻⁷). To assess the robustness of our results, we conducted sensitivity analyses for the associations between MRS and CKD using the 2021 (race-free) eGFR equation58. We identified 110 CKD patients using the 2021 (race-free) eGFR equation. Remarkably, the findings remained consistent. The established MRS was significantly associated with new CKD incidence (OR = 2.61, 95% CI = 1.37 – 5.05; P = 3.7 × 10⁻³). Compared to the initial model that only included age, sex, race, presence of DM, and/or HTN, the addition of MRS significantly improved the discriminative performance of incident CKD (area under the curve, 0.74 versus 0.70, likelihood ratio χ2 test P = 1.4 × 10⁻⁵) reaffirming the robustness of our results.
Lastly, we examined whether MRS could predict future kidney function decline in our cohort. Our cohort included 117 participants with at least 3 months of follow-up data after kidney sample collection. A mixed-effect model was used to identify factors associated with longitudinal eGFR levels, controlling for known clinical covariates and incorporating random-effects terms to account for differences in eGFR values between subjects and over time. The results showed that fibrosis MRS was significantly associated with longitudinal eGFR changes (beta = −18.7, P = 6.7 × 10⁻⁷; Fig. 7d). Furthermore, compared to the model where only clinical parameters were included, the inclusion of MRS significantly improved the model’s fitness (likelihood ratio test P = 6.1 × 10⁻¹¹, Akaike Information Criterion 2062.4versus 2111.9, R2 0.77 versus 0.67).
These findings suggest that fibrosis-related methylation information is clinically important for kidney function estimation and long-term prediction, highlighting the potential utility of MRS as a prognostic tool for CKD.
Methylation differences predict longitudinal eGFR change
We further wanted to elucidate whether methylation alterations could predict kidney disease development by analyzing a subset of 117 participants with longitudinal eGFR data available. To account for variability in the follow-up time and baseline eGFR, we used a linear mixed model that includes an individual-specific random effect for our analysis.
We discovered that the cytosine methylation levels of 15 CpG sites significantly correlated with changes in longitudinal eGFR at epigenome-wide significance (P < 9.42 × 10⁻⁸; Supplementary Fig. 8a-b; Supplementary Data 20). The strongest association was observed on chromosome 8 with cg09514524 (P = 7.56 × 10⁻⁹), located in the promoter region of glutamic pyruvate transaminase (GPT; Supplementary Fig. 8c), also known as cytosolic alanine aminotransaminase 1 (ALT1). ALT1 has been linked to non-alcoholic fatty liver disease and insulin resistance59.
Of the 15 identified CpG sites, 5 were also classified as fibrosis-DMPs (cg27630540, cg04659689, cg09514524, cg21366655, and cg25544164), and 4 were also eGFR-DMPs (cg27630540, cg04659689, cg01119571, and cg25544164). These findings suggest that CpG methylation may play role in long-term changes in eGFR, thereby providing a new perspective on how epigenetic changes can contribute to kidney disease progression.
In summary, our findings demonstrate that methylation differences at specific CpG sites can predict longitudinal eGFR changes, suggesting a potential role for epigenetic modifications in kidney disease development and progression.
- The Renal Warrior Project. Join Now
- Source: https://www.nature.com/articles/s41467-024-45295-y