Ethics statement
All protocols were approved by the ethics committee of Guizhou Provincial People’s Hospital (approval number: (2020)208) and adhered to the principles of the Declaration of Helsinki. All participants provided written informed consent before participation. Trained research doctors performed the baseline and follow-up assessments through face-to-face questionnaire interviews and physical measurements.
Study design and participants
This multicenter prospective cohort study was conducted in 22 HD units in Guizhou Province, China. This study recruited patients who underwent maintenance HD therapy in these HD units from June 1, 2015, to September 30, 2016. Patients were excluded if they were younger than 18 years, had HD treatment for less than three months, missed mid-arm measurement data at baseline and/or one year later, withdrew from HD, death, and lost to follow-up before the end of the one year. All the patients performed HD with conventional dialyzers under the standard temperature (35.5–36.5 °C). The dialysate composition is usually composed of sodium (130–140 mmol/L), potassium (3–4 mmol/L), chloride (96–110 mmol/L), calcium (1.5–1.75 mmol/L), magnesium (0.6–1.0 mmol/L), bicarbonate (32–38 mmol/L). The electrolyte concentrations would be adjusted accordingly. The dialysis modes were decided according each HD unit.
Anthropometric measurements
Mid-arm measurements were performed on the non-fistula arm by trained workers following standardized protocols for anthropometric measurements, as recommended by the World Health Organization. TSF thickness was measured at the mid-point of the posterior line between the olecranon and the tip of the acromion using skinfold calipers and recorded to the nearest 0.5 mm. MUAC was measured at the mid-point of the mid-upper arm with the elbow fully extended, and results were recorded to the nearest 0.1 cm. The mid-point of the mid-upper arm was defined as the midway between the olecranon process of the ulna and the acromion process of the scapula, which was located after bending the right arm to a 90° angle at the elbow.
Mid-arm muscle circumference (MAMC) was derived from the equation 22:
$${text{MAMC}}left( {{text{centimeters}}} right), = ,{text{MUAC }}left( {{text{centimeters}}} right) – pi , times ,({text{TSF}};{text{ thickness}}left[ {{text{centimeters}}} right]).$$
Other anthropometric measurements. Weight was measured using a calibrated beam scale with the participant wearing lightweight clothing, and height was measured without shoes using a portable stadiometer. BMI was calculated as weight (kilograms) divided by height (meters) squared (overweight ≥ 24 kg/ m2). Waist circumference (WC) was measured at a point midway between the lowest rib and the iliac crest in a horizontal plane, and hip circumference was measured using non-plastic tape (central obesity ≥ 90 cm for males, and ≥ 85 cm for females). Waist-height ratio (WHtR) was calculated as WC (centimeters) divided by height (centimeters).
We calculated TSF trajectory from the difference in TSF over the first 1 year after randomization as (TSF at 1 year visit—baseline TSF)/baseline TSF, expressed as a percentage. MUAC, BMI, and WHtR trajectories were measured similarly. The values for trajectories in mid-arm measurements (TSF and MUAC) were divided into four categories according to quartiles of changes in TSF and MUAC, respectively.
The cutoff of TSF and MUAC trajectories were determined by the median values, respectively. The selected thresholds were then used to define the C1 (≤ cutoff) and C2 (> cutoff) groups. The survival analysis was further performed in the groups cross-classified with trajectories of TSF and MUAC. According the cutoff group, patients were categorized into four group: T1 (C1 of both TSF and MUAC), T2 (C2 of TSF and C1 of MUAC), T3 (C1 of TSF and C2 of MUAC), and T4 (C2 of both TSF and MUAC).
Clinical covariate measurements
Information on demographic characteristics, obtained via a questionnaire, included age, sex, and educational level (high: ≥ 12th or low: < 12th). Lifestyle factors were collected via the questionnaire and included smoking status (current/ever smoker or never), alcohol consumption (yes or no), and living status (living alone or with family). Blood pressure was measured after rest for 10 min in the seated position using standard sphygmomanometers before the HD treatment. Comorbidities were scored the modified Charlson comorbidity index (mCCI) for each HD patient, based on ICD-10 diagnostic codes 23. All patients were evaluated with the malnutrition-inflammation score (MIS), a specifical nutritional scoring system of evaluating malnutrition and inflammation for dialysis patients, through questionnaire 24. Laboratory data within 1 month before the anthropometric assessment were collected from the medical records, including hemoglobin, albumin, serum creatinine, calcium, phosphorus, uric acid, triglyceride, total cholesterol, parathyroid hormone (PTH), high density lipoprotein-cholesterol (HDL-c), and low density lipoprotein-cholesterol (LDL-c).
Follow-up and outcomes
The primary endpoint was all-cause mortality. Participant death, the exact time of death, and the cause of death were identified from reports from each HD unit in each survey. The baseline for each participant was set as the survey day of the first entry into the survey with complete mid-arm measurements. The observation period was basically until either death, transfer to kidney transplantation, peritoneal dialysis, loss to follow-up, or the end of the study on September 30, 2022.
Statistical analysis
Participant baseline characteristics were described as a number (percentage) for categorical variables and means (SD) or as a median (interquartile range) for continuous variables. Normally distributed variables were expressed using mean ± standard deviation, whereas non-normally distributed variables were expressed as median and interquartile range. The differences among quartile groups divided by TSF, and MUAC trajectories were compared using one-way analysis of variance or the Kruskal–Wallis test for continuous variables and the chi-squared test for categorical variables.
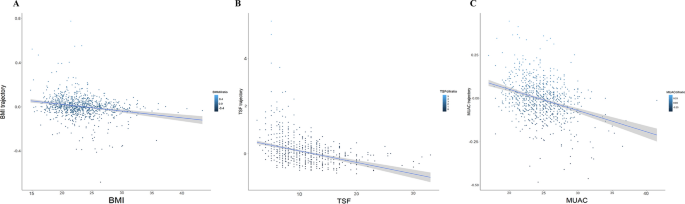
The associations between baseline and trajectory of BMI, TSF, and MUAC were analyzed with linear regression. Kaplan–Meier survival curves were used to assess the associations between trajectories of mid-arm measurements and mortality, with the log-rank test examining the significant differences between different groups. Cox proportional hazards models were used to calculate hazard ratios (HRs) and 95% confidence intervals (CIs) for all-cause mortality, and multiple covariates were included in multivariable-adjusted models. TSF and MUAC trajectories were analyzed as continuous variables (per SD increment), quartile variables, and threshold values. Model 1 was adjusted for age, sex, educational level, living status, smoking status, and alcohol consumption. Model 2 was adjusted for the variables in Model 1 as well as systolic blood pressure, diastolic blood pressure, and diabetes, hypertension, cardiovascular disease, dialysis frequency, hemoglobin level, albumin level, creatinine level, MIS, mCCI, and BMI trajectory. Model 3 was adjusted for the variables in Model 2 as well as baseline BMI, TSF, and MUAC. To examine the independent association between TSF and MUAC trajectories, a mutually adjusted model was created by including both MUAC and TSF change as well as the covariates in Model 3. In order to model the shape of associations with flexibility and to test for linearity, restricted cubic splines (RCS) with three knots at the 10th, 50th, and 90th centiles were used for TSF and MUAC trajectories in multivariable-adjusted models.
Possible modifiers of the association between TSF, MUAC trajectories with the risk of all-cause mortality were assessed for variables including age (< 65 years or ≥ 65 years), sex (male or female), diabetes (yes or no), BMI (Overweight or no), WC (central obesity or no) at baseline, and MUAC/TSF trajectory, respectively. The heterogeneity between groups was determined using the P value for heterogeneity, which was calculated with multiplicative terms by multiplying mid-arm measurements by continuous variables used in the multivariable model.
Additionally, as kidney transplantation was a competing risk event against death, the cumulative incidence considering the competing risk was compared using Gray’s test, and the Fine and Gray sub-distribution hazards model was used in the multivariate model as a sensitivity analysis method for the outcome, together with the standard Cox regression model for cause-specific hazards.
All statistical analyses were performed with R version 4.2.2 (www.r-project.org/), and P < 0.05 (two-sided) was considered statistically significant.
Ethical standards
Ethical approvals were obtained from Guizhou Provincial People’s Hospital-Research Ethics Committees (Approval number: (2020)208). All participants provided written informed consent and all research procedures were conducted in accordance with relevant guidelines and regulations.
- The Renal Warrior Project. Join Now
- Source: https://www.nature.com/articles/s41598-024-64728-8