Study design and population
The NHANES (National Health and Nutrition Examination Survey) is an ongoing nationwide survey conducted to assess the health and nutritional status of the general population in the United States. This is designed as a cross-sectional study that provides valuable insights into the health conditions and trends of Americans. The survey is conducted under the approval of the National Center for Health Statistics (NCHS) Ethics Review Board, ensuring adherence to ethical considerations (protocol number: 98 − 12). Informed consent is obtained from all participants who voluntarily participate in the survey. Detailed study protocols and findings are accessible on the Centers for Disease Control and Prevention (CDC) website in the United States (http://www.cdc.gov/nchs/nhanes.htm). This study was based on a sample of individuals who participated in two consecutive 2-year cycles of NHANES (2001–2002 and 2003–2004). This specific period was selected because information on ED was only available for the years 2001 to 2004.
A total of 21,591 participants from the NHANES pool between 2001 and 2004 were included as subjects in this study. Initially, women (n = 11,118) and men younger than 20 years of age (n = 5,347) were excluded. Further exclusions were based on the following criteria: (1) incomplete ED survey responses (n = 768); (2) unknown UA data (n = 179); (3) unknown demographic data, including age, race, education level, poverty income ratio (PIR), and marital status (n = 243); (4) unknown data regarding physical activity, body mass index (BMI), hypertension and diabetes (n = 126). Following the screening process, a final study cohort of 3,810 participants was included (Fig. 1).
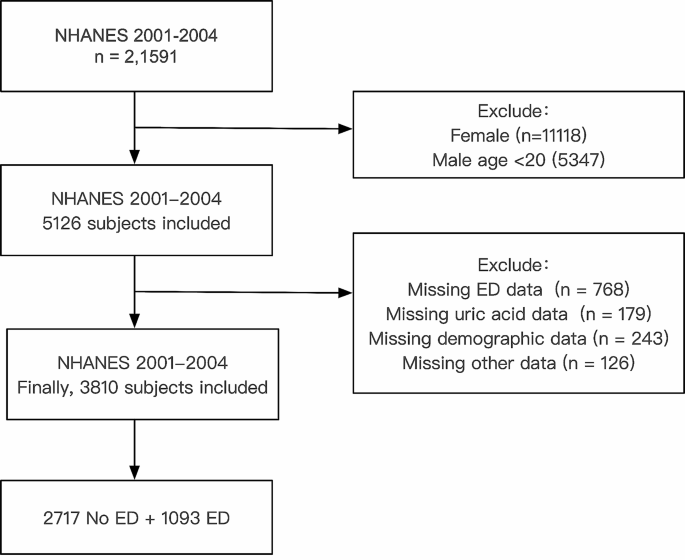
Flow chart of the sample selection process
Assessment of ED
In this study, the interviews were conducted in a private room at the Mobile Examination Center (MEC) using an audio computer-assisted self-interview (ACASI) format. The assessment of ED as the outcome variable was carried out through a single question adapted from the Massachusetts Male Aging Study [8]. This self-reported ED item has demonstrated accurate prediction of clinician-diagnosed ED and may serve as a useful screening tool for referrals [9]. This question asked participants to describe their ability to obtain and maintain an erection sufficient for satisfactory intercourse. The response options for participants included “always or almost always able,” “usually able,” “sometimes able,” and “never able” when asked about their ability to maintain an erection. In this analysis, ED was defined as participants who responded as “sometimes able” or “never able” to maintain an erection. Conversely, participants who answered “always or almost always able” or “usually able” were classified as not having ED [10]. In a sensitivity analysis, we performed a stringent redefinition of ED by considering only those participants who responded “never able” to maintain an erection.
Covariates of interest
This study considered various covariates, including age, race, PIR (a ratio of family income to poverty threshold), education level, BMI(Kg/m2), marital status, physical activity, hypertension, diabetes, CVD, hypercholesterolemia, arthritis, UA, serum creatinine, smoking status, and alcohol intake. Vigorous activities, defined as physical activities resulting in heavy sweating or substantial increases in breathing or heart rate, were distinguished from moderate activities, which involve engaging in activities for a minimum of 10 min that cause only light sweating or a slight to moderate increase in breathing or heart rate. Participants who reported having smoked at least 100 cigarettes throughout their lifetime were categorized as smokers. Among smokers, those indicating they currently smoke “every day” or “some days” were classified as current smokers, while those reporting not currently smoking at all were classified as former smokers. Nonsmokers were individuals who had smoked fewer than 100 cigarettes in their lifetime. Nondrinkers were participants who answered “no” to consuming at least 12 alcohol drinks in their entire life and in any one year. Former drinkers were participants who reported consuming at least 12 alcohol drinks during their life or in any one year but reported no alcohol consumption in the past 12 months. Current drinkers were study individuals who reported consuming at least 12 alcohol drinks during their life or in any one year and confirmed consuming at least one alcohol drink in the past 12 months [11]. CVD included participants who had previously been diagnosed with congestive heart failure, coronary heart disease, angina, heart attack, or stroke. Hypercholesterolemia was defined as participants with total cholesterol levels higher than 6.2 mmol/L [12]. In this study, participants were categorized into three groups based on their UA levels: <3.5 mg/dL, 3.5–7.0 mg/dL, and > 7.0 mg/dL [2]. A UA level higher than 7.0 mg/dL was considered indicative of hyperuricemia. The data on depression was insufficient for conducting the regression analysis.
Statistical analysis
In this study, we accounted for the multistage design of the NHANES in all statistical analyses by systematically selecting sampling weights, strata, and primary sampling units. The baseline characteristics table presented unweighted medians and interquartile range (IQR) for continuous variables, and unweighted frequencies and percentages for categorical variables. To assess the differences between participants with or without ED in complex survey samples, we employed the Wilcoxon rank-sum test for continuous variables and the chi-squared test with Rao & Scott’s second-order correction for categorical variables. Weighted-univariable and weighted-multivariable logistic regression analyses were conducted to examine the relationship between UA and the prevalence of ED. Four models were used in the analyses of the association between UA and ED. In the sensitivity analysis, ED was redefined as participants who responded “never able” to maintain an erection.
A significance level of < 0.05 was used for two-sided p-values to determine statistical significance. All statistical analyses were conducted using R (version 4.3.1) from The R Foundation (http://www.R-project.org).
- The Renal Warrior Project. Join Now
- Source: https://bmcnephrol.biomedcentral.com/articles/10.1186/s12882-024-03621-y