Clinical characteristics of the participants stratified by sex and eGFR
The clinical characteristics of the study participants stratified by sex and eGFR (< 60 or ≥ 60 mL/min/1.73 m2) are shown in Table 1.
In the male participants, those with an eGFR ≥ 60 mL/min/1.73 m2 were older, and had a higher prevalence of diabetes mellitus and hypertension, smoking and alcohol consumption, regular exercise habits, systolic and diastolic BPs, BMI, fasting glucose, triglycerides, eGFR and uric acid levels, and lower hemoglobin, total cholesterol, HDL-C, and LDL-C compared to those with an eGFR < 60 mL/min/1.73 m2. Regarding WGBT, there were no significant differences between the two groups in either the midday or working hour periods.
In the female participants, those with an eGFR ≥ 60 mL/min/1.73 m2 were older, and had a higher prevalence of diabetes mellitus and hypertension, smoking, regular exercise habits, systolic and diastolic BPs, BMI, fasting glucose, triglycerides, total cholesterol, LDL-C, eGFR and uric acid, and lower hemoglobin, and HDL-C compared to those with an eGFR < 60 mL/min/1.73 m2. Regarding WGBT, the participants with an eGFR < 60 ml/min/1.73 m2 had significantly higher WGBT values at 1 year, 3 years and 5 years in both midday and working hour periods compared to those with an eGFR ≥ 60 mL/min/1.73 m2.
Association of heat stress with eGFR < 60 ml/min/1.73 m2 by sex
Table 2 shows the association between heat stress and eGFR < 60 ml/min/1.73 m2 stratified by sex. Multivariable logistic regression was performed adjusting for age, diabetes, hypertension, smoking and alcohol history, regular exercise, systolic and diastolic BPs, BMI, fasting glucose, triglycerides, HDL-C, LDL-C, hemoglobin, and uric acid. The results showed that in the male participants, during the midday period, the 1-, 3-, and 5-year average WBGT values per 1 ℃ increase were significantly positively associated with eGFR < 60 ml/min/1.73 m2 (odds ratio [OR], 1.096, 95% CI = 1.002–1.199, p = 0.044 for 1 year; OR, 1.093, 95% CI = 1.000–1.196, p = 0.005 for 3 years; OR, 1.094, 95% CI = 1.002–1.195, p = 0.045 for 5 years). However, no significant associations were found during the working hours period.
In the female participants, during the midday period, the 1-, 3-, and 5-year average WBGT values per 1 ℃ increase were significantly negatively associated with eGFR < 60 ml/min/1.73 m2 (OR, 0.872, 95% CI = 0.778–0.976, p = 0.018 for 1 year; OR, 0.874, 95% CI = 0.780–0.978, p = 0.019 for 3 years; OR, 0.875, 95% CI = 0.784–0.977, p = 0.018 for 5 years). In addition, during the working hours period, the 1-, 3-, and 5-year average WBGT values per 1 ℃ increase were also significantly negatively associated with eGFR < 60 ml/min/1.73 m2 (OR, 0.856, 95% CI = 0.774–0.946, p = 0.002 for 1 year; OR, 0.856, 95% CI = 0.774–0.948, p = 0.003 for 3 years; OR, 0.853, 95% CI = 0.772–0.943, p = 0.002 for 5 years). The results in Table 2 are further illustrated in the forest plot presented in Fig. 2.
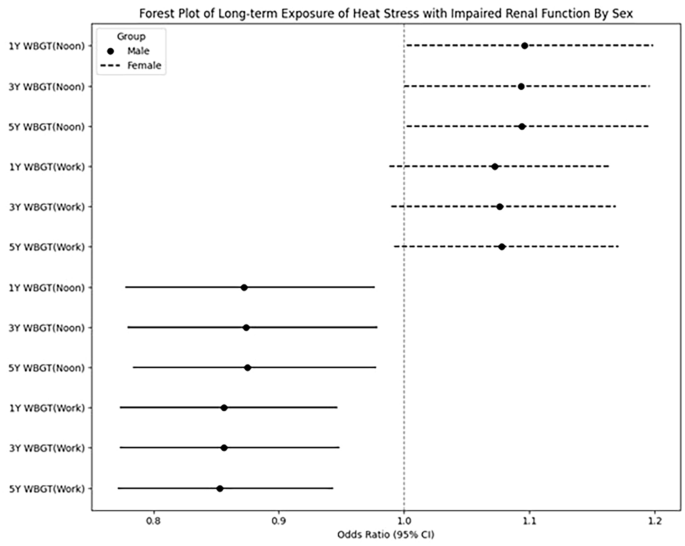
Forest plot of long-term exposure of heat stress with impaired renal function in different sex.
Supplementary Figs. 1–1 to 2–6 demonstrate the non-linear relationship between WBGT values and eGFR < 60 ml/min/1.73 m2 using restricted cubic splines and show the histogram of WBGT value distribution. In the restricted cubic spline plots, the solid line represents the estimated odds ratio for eGFR < 60 ml/min/1.73 m2, with dashed lines indicating the 95% confidence intervals.
For male participants (Supplementary Figs. 1–1 to 1–6), higher 1-, 3-, and 5-year average WBGT values are associated with an increased risk of eGFR < 60 ml/min/1.73 m2, while lower WBGT levels are linked to a decreased risk during both the midday and work periods. Conversely, for female participants (Supplementary Figs. 2–1 to 2–6), higher 1-, 3-, and 5-year average WBGT values are associated with a decreased risk of eGFR < 60 ml/min/1.73 m2, whereas lower WBGT levels show an increased risk during both the midday and work periods.
Multivariable linear regression, adjusted for the same variables, was conducted to assess the relationship between WBGT and eGFR values. In male participants, WBGT was negatively associated with eGFR during both the midday period (β coefficient: − 0.275, 95% CI − 0.377 to − 0.173, p < 0.05 for 1 year; β coefficient: − 0.333, 95% CI − 0.433 to − 0.233, p < 0.05 for 3 years; β coefficient: − 0.291, 95% CI: − 0.402 to − 0.181, p < 0.05 for 5 years) and the working hours period (β coefficient: -0.159, 95% CI − 0.254 to − 0.065, p < 0.05 for 1 year; β coefficient: − 0.226, 95% CI -0.320 to − 0.131, p < 0.05 for 3 years; β coefficient: − 0.158, 95% CI − 0.262 to − 0.054, p < 0.05 for 5 years). For female participants, WBGT was negatively associated with eGFR during the midday period (β coefficient: − 0.065, 95% CI − 0.121 to − 0.008, p < 0.05 for 1 year; β coefficient: − 0.116, 95% CI − 0.171 to − 0.060, p < 0.05 for 3 years; β coefficient: − 0.078, 95% CI − 0.139 to − 0.017, p < 0.05 for 5 years), but no significant associations were found during the working hours period.
- The Renal Warrior Project. Join Now
- Source: https://www.nature.com/articles/s41598-024-65741-7