PLGA-PEG construction
Modification of PLGA
Five milligrams of PLGA-COOH (Resomer RG504H 38,000–54,000 MW; 719,900-5G, Millipore Sigma, Burlington, MA) was weighed into a 20 mL scintillation vial. Separately, 135 mg of N-hydroxysuccinimide (NHS; 130,672-100 g, Millipore Sigma) and 230 mg of 1-ethyl-3-(3-dimethylaminopropyl)-carbodiimide (EDC; E6383-1G, Millipore Sigma) was added into a 1.5 mL tube. EDC and NHS were dissolved with PLGA-COOH in 10 mL methylene chloride (DCM; 270,997, Millipore Sigma) overnight on a stir plate. The polymer was precipitated in 10 mL of pre-chilled ethyl ether (E138-1, Fisher Scientific, Hampton, NH). Briefly, PLGA-NHS solution was added dropwise to cold ethyl ether, followed by three washes with 10 mL pre-chilled 1:1 methanol (A456-4, Fisher Scientific) to ethyl ether solution. The resulting polymer was vacuum dried for 4 h and stored at − 20 °C.
Conjugation of PEG to PLGA
One gram of PLGA-NHS was added to 250 mg NH2-PEG-COOH (PG2-AMCA-5 K, Nanocs Inc., New York, NY) and 37.7 uL of N, N-diisopropylethylamine (D125806, Millipore Sigma), then dissolved in 4 mL of chloroform (C606-4, Fisher Scientific). After overnight stirring reaction, PLGA-PEG was precipitated in 10 mL of pre-chilled methanol as mentioned above. The resulting polymer was vacuum dried and stored at − 20 °C.
Nanoparticle preparation and characterization
Rapamycin (HY-10219, MedChem Express, Monmouth Junction, NJ) loaded PLGA-PEG MNPs were prepared using the nanoprecipitation method. Briefly, 100 mg of PLGA-PEG and 20 mg of rapamycin were dissolved in 2 mL of acetonitrile. This solution was added dropwise to a round bottom flask containing 4 mL of deionized water with 2% pluronic F-68 solution at a flow rate of 0.1 mL/min. After 2 h of stirring in a fume hood, MNPs were centrifuged at 7356 g in 50 mL conical tubes. MNPs were washed three times with 10 mL of water, resuspended in 10 mL of 5% sucrose solution, and lyophilized. The encapsulated amount of rapamycin was quantified using reversed-phase high-performance liquid chromatography (RP-HPLC). Briefly, 20 mg of MNPs were reconstituted in 1 mL of water, centrifuged at 33,000 g, then dissolved in 200 uL of acetonitrile. Rapamycin was quantified comparing absorbance against a standard curve. Average rapamycin loading was 6 µg per 1 mg of lyophilized MNPs. The release profiles of small molecules encapsulated in MNPs exhibit similar kinetics to each other and involve an intial burst release followed by a sustained release from the MNP14,20. We therefore predict that encapsulated rapamycin follows the initial burst release profile due to the compound’s hydrophobicity (theoretical log P value 4.63: source Pubchem). MNPs were also encapsulated with 3,3′-diethylthiadicarbocyanine iodide (Cy5) dye (DEDC) to fluorescently label. To do so, 10 mg of DEDC was dissolved with PLGA-PEG instead of rapamycin. The encapsulated amount of DEDC was quantified using UV–Vis spectrophotometry.
The physicochemical characterization of MNPs were measured by dynamic light scattering (DLS) using Malvern’s ZetaSizer Pro. Approximately 1 mg of lyophilized MNPs were reconstituted in 1X phosphate buffered saline (PBS) to measure hydrodynamic diameter and polydispersity index. Alternatively, MNPs were dissolved in water to measure zeta potential.
Animals
Experimental protocols were approved by the Institutional Animal Care and Use Committee at the University of Alabama at Birmingham and performed in accordance with the National Institutes of Health Guide for the Care and Use of Laboratory Animals. Additionally, this study was reported in accordance with Animal Research: Reporting of In Vivo Experiments (ARRIVE) guidelines (https://arriveguidelines.org). Conditional Pkd1 knockout (Pkd1KO) mice were generated by crossbreeding female Pkd1-floxed mice21 with male Pkd1-floxed mice containing a tamoxifen inducible systemic Cre (CAGG-CreER)22. Genotyping, performed using previously described primer sequences21, designated “flox” controls as mice lacking Cre. Male and female mice were equally utilized and maintained under constant temperature and humidity, a 12:12 h light–dark cycle, and water ad libitum. Flox and Pkd1KO mice (5–6 weeks old) received an intraperitoneal (IP) injection of Tamoxifen (T5648, Millipore Sigma; 9 mg/40 g) dissolved in corn oil every other day for a total of three doses. Kidney, liver, heart, lung, spleen, and serum were harvested under constant isoflurane inhalation followed by thoracotomy and either frozen at − 80 °C for biochemical analyses or immersed in respective buffers for histology or immunostaining.
Nanoparticle delivery
Two weeks after tamoxifen induction, Pkd1KO mice were administered a single tail-vein injection (50 mg/kg, 200 μL) of mesoscale nanoparticles (MNP) encapsulating DEDC. The average particle size was 352.4 ± 9.6 nm with a polydispersity index (PDI) of 0.197 and zeta potential (ZP) of -39.2 mV. Subsequently, mice were dosed with either empty MNP (1 mg/kg), free rapamycin (Rapa) (1 mg/kg), or RapaMNP (1 mg/kg) to evaluate potency over time. The hydrodynamic diameter of RapaMNPs were 345.1 ± 5.0 nm with a 0.312 PDI and − 32 mV ZP. The loading of rapamycin was 6 µg per 1 mg of MNPs. In a separate study, Pkd1KO mice were chronically treated (1 mg/kg) via tail vein twice a week for a total of six weeks. Chronically treated mice were euthanized under constant isoflurane inhalation followed by thoracotomy one week after the final dose.
Ex vivo fluorescent imaging
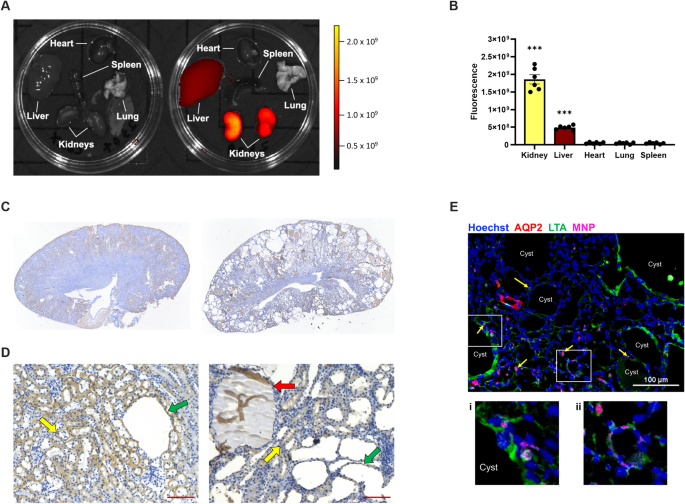
To measure tissue-specific delivery of administered nanoparticles, organs were harvested 24 h after a single tail vein injection (n = 3) and fluorescent intensity was captured using an IVIS 100 in vivo imaging system (PerkinElmer, Waltham, MA).
Immunohistochemistry
Kidneys were fixed overnight in 10% formalin, followed by 70% ethanol until embedded in paraffin blocks. Embedded tissue was sectioned (5 μm), deparaffinized, and hydrated with decreasing amounts of ethanol. Following an incubation in 0.3% hydrogen peroxide solution, slides were heated in antigen retrieval buffer (00-4956-58, Invitrogen, Waltham, MA), then blocked for 30 min with 10% normal rabbit serum. Slides were incubated for 5 h at 4 °C with PEG primary antibody (ab94764, Abcam; 1:200) and 1 h at room temperature with biotinylated rabbit anti-rat secondary antibody (PK-4004, Vector Laboratories, Newark, CA; 1:200) prior to staining with 3,3′-diaminobenzidine (DAB; SK-4100, Vector Laboratories) and dehydration.
Immunofluorescent Staining
Kidneys were stained as previously described23. Briefly, 30% sucrose cryopreserved tissue sections were fixed with 4% paraformaldehyde and permeabilized with 0.2% Triton X-100, then blocked with 2% donkey serum (ab7481, Abcam) before incubation with aquaporin 2 (AQP2) (ab62628, Abcam) primary and goat anti-rabbit IgG Alexa Fluor 647 (A21244, Invitrogen) secondary antibodies. Slides were subsequently stained with fluorescein isothiocyanate (FITC)-conjugated lotus tetragonolobus agglutinin (LTA) (FL-1321, Vector Laboratories) and Hoechst 33,342 nuclear stain (H3570, Fisher Scientific). Fluorescent images were captured using a Nikon TI2 Eclipse (Nikon Instruments) spinning disc confocal microscope equipped with a Yokogawa 31 disc (Yokogawa) on an Orca Flash 4.0 sCMOS (Hamamatsu) using a 403 Plan Fluor 1.3NA (Nikon Instruments) objective.
Liquid chromatography tandem mass spectrometry
Rapamycin was quantified using liquid chromatography-tandem mass spectrometry (LC–MS/MS) with ascomycin (A-094, Cerilliant Corp., Round Rock, TX) serving as an internal standard. The standard curve was established with nine calibrants, offering a linear range of 0.1–1000 ng/mL. Serum and tissue samples were prepared by thawing on ice, spiking with ascomycin, and processing with Phree Phospholipid Removal (8BS133TAK, Phenomenex, Torrance, CA). Samples were then mixed with 1% formic acid in acetonitrile, filtered, dried under nitrogen gas, and reconstituted in 50% methanol. Tissue samples underwent an additional homogenization step using a bead beater homogenizer prior to filtering. The prepared samples and calibrants were analyzed using a Shimadzu Prominence 20 HPLC in tandem with a Sciex 6500 Qtrap Mass Spectrometer. The LC–MS/MS conditions were sourced from Phenomenex tech note TN-1169, ensuring the reliability and reproducibility of the analysis. This comprehensive process ensured the samples were adequately prepared for subsequent analysis.
Western blot
Flox and Pkd1KO kidney tissue samples were homogenized and probed as previously described24. Membranes were blocked with 5% PhosphoBLOCKER Blocking Reagent (AKR-103, Cell Biolabs, Inc., San Diego, CA) for 30 min followed by a 4 °C overnight incubation with phospho-S6 ribosomal protein (Ser240/244; 5364, Cell Signaling, Danvers, MA) primary antibody and goat anti-rabbit IgG, DyLight 680 (35,569, Fisher Scientific) for 1 h at room temperature. Equal protein loading was verified by β-actin staining (3700, Cell Signaling; followed by goat anti-mouse IgG, DyLight 800 [SA5-10176], Fisher Scientific) and shown in each representative figure.
Cyst quantification
Kidney and liver Sects. (5 μm) were cut and stained with hematoxylin–eosin (H&E). Whole kidney images were captured at 4× magnification using a Keyence BZ-X710 (Itasca, IL) microscope and analyzed using Image J as previously published24. Larger, representative cyst images were captures at 10× magnification.
Statistical analyses
Data are presented as means ± SEM. Differences between group means were analyzed using GraphPad Prism 10 (La Jolla, CA) by Ordinary one-way or two-way ANOVA with Tukey’s multiple comparisons post hoc test, as noted. P < 0.05 denoted statistically significant.
- The Renal Warrior Project. Join Now
- Source: https://www.nature.com/articles/s41598-024-65830-7