Study design and study participants
This study is a retrospective cohort study involving patients at St. Marianna University Hospital. It included all adult patients who underwent native kidney biopsy from January 1, 2006, to September 30, 2022. Patients with inconclusive diagnoses and those with multiple primary diagnoses were excluded. The data for the cohort were collected from electronic health records, with patients who underwent kidney biopsy between January 1, 2006, and December 31, 2019, included in the derivation cohort, and those who underwent biopsy between January 1, 2020, and September 30, 2022, included in the validation cohort. Details of patient selection for the derivation and validation cohorts are shown in Fig. 1.
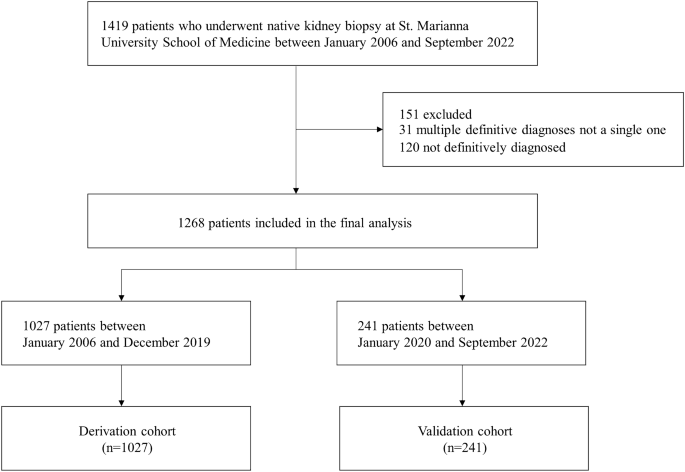
Flow diagram of patient selection.
Ethics approval
This study was conducted according to “The Declaration of Helsinki”, “the Transparent Reporting of a Multivariable Prediction Model for Individual Prognosis or Diagnosis Statement”21, and “Guidelines for Developing and Reporting Machine Learning Predictive Models in Biomedical Research: A Multidisciplinary View”22. The study protocol was approved by the institutional review board of St. Marianna University Hospital (approval number 6025). As the study was retrospective and involved minimal risk, the requirement for informed consent was waived.
Predictor variables
We utilized information that is routinely measured in clinical practice as potential predictor variables. Baseline data of patients before the native kidney biopsy were retrospectively collected from electronic health records. These included demographic characteristics, blood tests, and urine tests. Demographic characteristics included age, sex, height, weight, body mass index, and blood test items comprising white blood cells, hemoglobin, total protein, albumin, blood urea nitrogen, creatinine, uric acid, aspartate aminotransferase, alanine aminotransferase, alkaline phosphatase, lactate dehydrogenase (LDH), creatine kinase (CK), total cholesterol, glucose, hemoglobin A1c, C-reactive protein, immunoglobulin G (IgG), immunoglobulin A (IgA), immunoglobulin M (IgM), complement C3, complement C4, IgA/complement C3 ratio (IgA/C3), antinuclear antibodies. Urine test items included urine protein/creatinine ratio (UPCR) and urine red blood cells (Urine RBC), with Urine RBC scored on a scale of 0 = < 1/high power field (HPF), 2.5 = 1– 4/HPF, 7.5 = 5–9/HPF, 20 = 10–29/HPF, 40 = 30–49/HPF, 75 = 50–99/HPF, 100 = ≥ 100/HPF.
Outcome measures
The outcome of this study is the diagnosis of IgA nephropathy. The definitive diagnoses made through kidney biopsy by nephrologists were collected. IgA nephropathy was assigned as the correct label (1) and all other diagnoses as (0).
Data preprocessing
The number and proportion of missing values for each variable are shown in Supplementary Table S1. Variables with more than 20% missing values were not included in the analysis. To avoid potential bias arising from excluding patients with missing data, imputation was adopted. The k-nearest neighbor imputation algorithm was employed to fill in missing values for continuous variables. The variables were standardized to have a mean of 0 and a standard deviation of 1.
Variable selection
Effective variable selection not only enhances the learning process but also makes the results more accurate and robust. Given the importance of ensuring model reliability and trustworthiness in the medical domain, it is preferable to integrate the results of multiple feature selections instead of relying on a single feature selection23. Therefore, the variable reduction was performed to prevent overfitting of machine learning models and to reduce computational costs. Predictor variables with nearly zero variance, i.e., variables whose proportion of unique values was less than 5%, were excluded from the analysis. Four variable selection methods were applied to identify subsets of predictor variables. These methods included Least Absolute Shrinkage and Selection Operator, Random Forest-Recursive Feature Elimination, Random Forest-Filtering, and SelectFromModel with Extra Trees. The final predictor variables for model development were determined by integrating the results from the four methods, choosing variables that appeared three or more times across all methods.
Model development and evaluation
For model development, the following five machine learning algorithms—eXtreme Gradient Boosting (XGBoost), LightGBM, Random Forest, Artificial Neural Network, 1 Dimentional-Convolutional Neural Network (1D-CNN)—and logistic regression were applied to the data of the derivation cohort. XGBoost and LightGBM, along with Random Forest, are tree-based algorithms that combine decision trees with ensemble learning. XGBoost and LightGBM enhance predictive performance by sequentially building decision trees and correcting the errors of previous trees by boosting techniques24,25. Random Forest mitigates overfitting by independently training multiple decision trees and integrating their predictions through bagging techniques26. Artificial Neural Networks consist of an input layer, hidden layers, and an output layer, capable of handling complex relationships between inputs and outputs using non-linear activation functions27. 1D-CNNs are specialized neural networks designed to process sequential data by applying convolutional filters along one dimension, effectively capturing local patterns in time-series data. This makes them particularly useful for tasks involving sequential medical data28. Logistic regression is a statistical linear model widely used for binary classification, producing probabilistic outputs and classifying as positive or negative based on a specific threshold29. To identify the optimal hyperparameters for each model, training, and validation were conducted in the derivation cohort using 5-repeated five-fold cross-validation. Bayesian optimization was used for hyperparameter tuning. The hyperparameters of each model tuned are shown in Supplementary Table S2.
The performance of the final prediction models was evaluated in both the derivation and validation cohorts. The model performance was assessed using the Area Under the Receiver Operating Characteristic curve (AUROC) and the Area Under the Precision-Recall Curve (AUPRC). The 95% confidence intervals (95% CI) for each metric were generated through 1000 bootstrap iterations with unique random seeds. AUROC and AUPRC were selected as they reflect performance across all classification thresholds and are less affected by class imbalance. The deep ROC analysis was also performed to assess discriminability in more detail30. Three groupings were made according to the false positive rate, and the normalized group AUROC, mean sensitivity, and mean specificity for each group were calculated. The model calibration was evaluated using calibration plots and the Brier score. Calibration plots compare the actual positive fraction to the average predicted probability across quintiles of predicted probability. The Brier score, reflecting the mean squared difference between predicted probabilities and actual outcomes, serves as a dual measure of predictive performance and calibration.
Model interpretations
The SHapley Additive exPlanations (SHAP) method was used to explore the interpretability of the models with high diagnostic performance. SHAP provides a unified approach for the interpretation of model predictions, offering consistent and locally accurate attribution values, i.e., the SHAP values, for each variable within the predictive model31. The role of each variable in predicting IgA nephropathy can be explained as their collective contributions to the overall risk output for each case.
Sensitivity analysis
Sensitivity analysis was performed to examine the differences in results caused by data split. In this analysis, ten-fold cross-validation was performed on all the data without splitting the data by the derivation cohort and the validation cohort, and adjusting hyperparameters, training, and evaluating the performance.
Statistical analysis
Continuous variables were described using mean and standard deviation for normally distributed data, and median values along with interquartile ranges for non-normally distributed data. Categorical variables were presented as counts and percentages. For statistical comparisons, the Student’s t-test was applied to normally distributed continuous variables, the Mann–Whitney U test to non-normally distributed continuous variables, and the chi-square test to categorical variables. Variables with a two-tailed p-value less than 0.05 were considered statistically significant. For variable selection, we employed the sklearn library in Python (version 3.10.12). Model development utilized the sklearn, xgboost, lightgbm, and torch libraries and evaluation was conducted using the sklearn, optuna, deeproc, and shap libraries. R (version 4.2.2) was used for statistical analyses.
Ethics approval and consent to participate
The study was performed in accordance with the Declaration of Helsinki and Ethical Guidelines for Medical and Health Research Involving Human Subjects. The study was approved by the St. Marianna University Hospital Institutional Review Board (approval number: 6025) which allowed for analysis of patient-level data with a waiver of informed consent.
- The Renal Warrior Project. Join Now
- Source: https://www.nature.com/articles/s41598-024-63339-7