Quality control and mapping of RNA sequencing data
To assess unbiased transcriptomics data, RNA was extracted from the Inferior vena cava (IVC) of 6 sham-operated mice and 6 mice with patent AVF, with equal numbers of female and male mice on postoperative day 7. The qualities of the 12 total RNA extractions from the 12 IVC samples were sufficiently high with a mean RNA quality number (RQN) 9.0 ± 0.4 (Supplementary Table S1). The raw RNA sequencing data were obtained by preparing messenger RNA (mRNA) libraries and performing next generation sequencing (NGS). The average read counts were 28,364,587 ± 1,700,233 and the sequence lengths were 101 bases in all reads. After quality control, the average read counts were 27,193,479 ± 1,665,134 and the sequence lengths distributed from 36 to 101 bases. Mapping to the reference genome, the average number and percentage of the uniquely mapped reads were 22,392,491 ± 1,456,774 and 82.3 ± 1.6%, respectively. Since the sequencing data were mostly conserved after quality control and appropriately mapped along the reference genome, all mRNA expression values derived from the 12 whole transcriptomics data were utilized.
Differentially expressed genes (DEG) and gene ontology (GO) enrichment analysis comparing the sham and AVF groups
To determine differences between the IVC in mice treated with either a sham procedure or an AVF, we identified differentially expressed genes (DEG) from the transcriptomics data. Among the 15,912 genes that were sufficiently expressed in the data set, 1057 genes were expressed differentially between the 2 groups, setting the cutoff as |log2(Fold Change) |≥ 1 and adjusted p value < 0.05. Compared with the IVC in sham mice, 696 genes had significantly increased expression in mice with an AVF, and 361 genes had significantly increased expression in sham-operated mice (Fig. 1a). mRNA expression of the 1057 DEG are shown with a heatmap plot (Fig. 1b) and a principal component analysis (PCA) plot (Fig. 1c) that show homogenous expression of the 6 sham samples, whereas the 6 AVF samples were relatively more heterogeneous. Of note, we observed that the AVF were clustered into 2 groups, a group of 4 AVF samples (Fig. 1c, blue circle) that were significantly different than the 6 sham samples (Fig. 1c, green circle) and a group of 2 AVF samples (Fig. 1c, red circle) that were distinctly different from the 4 AVF samples. The 2 outlying AVF samples (the ‘outliers’ group, OUT) consisted of 1 male (sample #05) and 1 female AVF (sample #09), and the 4 other AVF samples (the ‘normal’ AVF group, nAVF) consisted of 2 female and 2 male AVF. All 6 AVF were patent. To validate the separation of the 2 outlying AVF, a hierarchial sample clustering was performed; the 2 samples in the OUT group were clustered separately from the other 4 samples in the nAVF group, with an average silhouette score 0.426 (Fig. 1d)30.
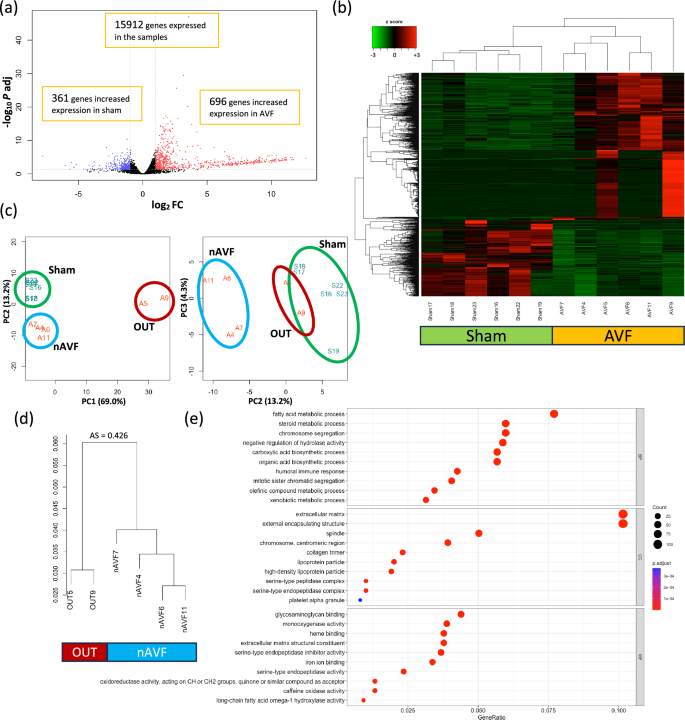
Differentially expressed genes (DEG) and gene ontology (GO) enrichment analyses between the sham and AVF groups. (a) Volcano plot of 15,912 genes expressed among the 12 samples (n = 6 sham, n = 6 AVF). 1057 genes were expressed differentially; genes (n = 696) with increased expression in AVF samples are in red dots, and genes (n = 361) with increased expression in sham samples are in blue dots. (b) Heatmap plot of the 1057 DEG. (c) Principal component analysis (PCA) plot of the 12 samples grouping the 1057 DEG. The 6 sham samples are circled in green; the 4 normal AVF (nAVF) samples are circled in blue; the 2 outlier (OUT) samples are circled in red. (d) Dendrogram of the hierarchial sample clustering. The 2 samples in the OUT group were clustered in a group distinct from the other 4 AVF samples (nAVF). The average silhouette (AS) score was 0.426. (e) GO enrichment analysis. 317 GO terms were significantly overrepresented among the 1057 DEG. GO terms of the top 10 lowest adjusted P values for each ontology (BP, CC, and MF) are shown. The x-axis shows the ratio of the number of DEG allocated to each GO term compared to the total number of DEG. The color of each dot reflects the adjusted P values. AVF arterio-venous fistula, AS average silhouette score, Log2FC logarithm of a fold change of AVF vs Sham to base 2, P adj adjusted P value calculated by the Benjamini–Hochberg procedure, PC principal component, nAVF normal AVF, OUT outliers, BP biological process, CC cellular component, MF molecular function.
To compare differential gene expression between the sham and AVF groups, gene ontology (GO) enrichment analysis was performed on the 1057 DEG. 317 GO terms were significantly overrepresented among the 1057 DEG. GO terms generally consisted of 3 subgroups, and there were 229 biological process (BP) terms, 20 cellular component (CC) terms and 68 molecular function (MF) terms within the 317 GO terms; the top 10 BP, CC and MF terms with the lowest adjusted p values were shown in Fig. 1e. To validate the heterogeneity within the AVF group, we extracted 13 GO terms related to immunity and 5 GO terms related to coagulation among the 317 GO terms (Supplementary Figs. S1, S2). 64 DEG were included in the 13 immune terms and 37 DEG in the 5 coagulation terms. Heatmap plots of the 64 immune genes and the 37 coagulation genes showed that the 2 AVF samples (sample #05 and #09) forming the OUT group showed different patterns of gene expression than the 4 AVF samples forming the nAVF group (Supplementary Figs. S1, S2). These data suggest that although all 6 of the AVF showed gene expression that was distinct from the sham veins, 2 of the 6 AVF (‘OUT’) showed a different pattern of gene expression compared to 4 of the 6 AVF (‘nAVF’).
Gene expression microarray analysis comparing sham and AVF groups
To validate the RNA-seq results, we examined our previously performed gene expression microarray analysis23,31. In the microarray data, comparing 4 IVC samples from mice with an AVF with 4 IVC samples from sham-operated mice on postoperative day 7, 1196 genes were identified as DEG; MetaCore pathway analysis showed 39 pathways were significantly changed between the sham and AVF (Supplementary Table S2). Among these pathways, many metabolic pathways, such as tricarboxylic acid cycle and mitochondrial long chain fatty acid beta-oxidation, were significantly different. Six pathways related to cell cycle and a pathway of extracellular matrix (ECM) remodeling were also different between the sham and AVF groups. Analysis of several of these pathways showed that each of these metabolic pathways were significantly suppressed in the AVF (Supplementary Table S3). Importantly, almost all these genes downregulated in the AVF in the microarray analysis were also significantly less expressed in the AVF group in the RNA-seq data (Supplementary Table S3). These results show that the RNA-seq data are consistent with the previously reported gene expression microarray data and suggest that at least some metabolic pathways are suppressed during the early phase of venous remodeling.
Subgroup comparison between nAVF and OUT groups
To further examine the heterogeneity among the AVF group, physiological data were compared (Fig. 2a). There was no significant difference in body weight change (days 0 to 7) among the sham, nAVF and OUT groups. On postoperative day 7, all 6 sham-operated IVC and all 6 AVF were patent. The aorta diameter, IVC diameter, aorta peak systolic velocity, resistance index and IVC peak velocity showed statistically significant increases in both the nAVF and the OUT groups compared to the sham group; however, there were no significant differences between the nAVF and the OUT groups. These data suggest that the nAVF and OUT groups were patent and not physiologically distinguishable at day 7.
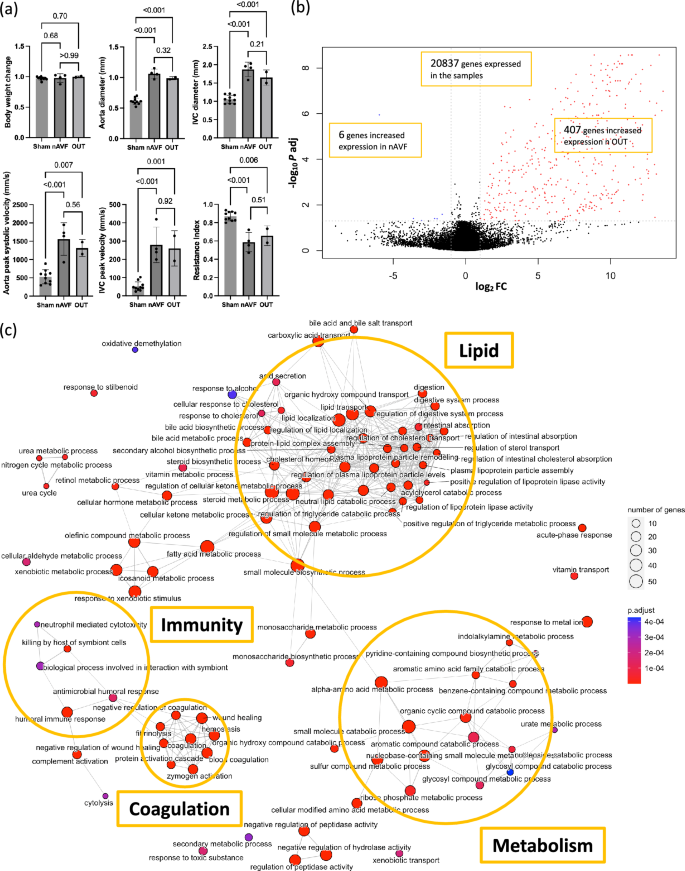
Differentially expressed genes (DEG) and gene ontology (GO) analyses between the normal AVF (nAVF) and outliers (OUT) groups. (a) Comparison of ultrasound findings among the sham (n = 6), nAVF (n = 4) and OUT (n = 2) samples. (b) Volcano plot of 20,837 genes expressed among the 6 AVF samples. 413 genes were expressed differentially; genes (n = 407) with increased expression in the OUT samples are in red dots, and genes (n = 6) with increased expression in the nAVF samples are in blue dots. (c) Enrichment map plot of the top 100 BP terms. Connected edges indicate mutually overlapping DEG sets. AVF arterio-venous fistula, IVC inferior vena cava, Log2FC logarithm of a fold change of nAVF vs OUT to base 2, P adj adjusted P value calculated by the Benjamini–Hochberg procedure, PC principal component, BP biological process, CC cellular component, MF molecular function.
DEG between the nAVF and the OUT groups showed that among the 20,837 genes that were sufficiently expressed in the data set, 413 genes were determined as DEG between the 2 groups, setting the cutoff as |log2(Fold Change) |≥ 1 and adjusted p value < 0.05. Compared with the nAVF group, 407 genes had significantly increased expression in the OUT group, whereas only 6 genes had significantly decreased expression (Fig. 2b). The heatmap plot and PCA plot both showed that the 2 groups were well separated with little overlap (Supplementary Fig. S3).
GO enrichment analysis of the 413 DEG between the nAVF and OUT groups showed 239 GO terms consisting of 150 BP terms, 19 CC terms and 70 MF terms. The top 10 BP, CC and MF terms with the lowest adjusted p values are shown in Supplementary Fig. S4. We observed that among the 150 BP terms, many terms related to metabolic processes, such as steroid metabolic process (GO:0008202), fatty acid metabolic process (GO:0006631), α-amino acid metabolic process (GO:1901605), aromatic compound catabolic process (GO:0019439), and glycosyl compound metabolic process (GO:1901657). In addition, terms related to immunity and coagulation were clustered in the enrichment map plots (Fig. 2c, Supplementary Fig. S4).
KEGG pathway enrichment analysis of the 413 DEG between the nAVF group and the OUT group showed 34 KEGG pathways that were significantly overrepresented (Table 1). Similar to the GO enrichment analysis, 16 metabolism-related pathways were detected including carbon metabolism (mmu01200), metabolism of xenobiotics by cytochrome P450 (mmu00980), arachidonic acid metabolism (mmu00590) and biosynthesis of amino acids (mmu01230), consistent with several metabolic processes being active in the OUT group compared with the nAVF group. The complement and coagulation cascades (mmu04610) were also overrepresented with the highest gene ratio and the lowest adjusted p value. These data are consistent with the nAVF and OUT groups having distinct patterns of gene expression, with notable increases in gene expression reflecting increased metabolism, immunity, and coagulation in the OUT group.
Subgroup analysis between the sham and nAVF groups
To characterize the difference in gene expression between the sham (n = 6) and nAVF (n = 4) groups, we performed another subgroup analysis, without the OUT (n = 2) samples. Among the 21,649 genes expressed sufficiently in the 2 groups, 403 genes had significantly different mRNA expression values, setting the cutoff as |log2(Fold Change) |≥ 1 and adjusted p value < 0.05. Compared with the sham group, 324 genes out of the 403 DEG were significantly upregulated in the nAVF group, while 79 genes were significantly downregulated in the nAVF group (Fig. 3a). The heatmap and PCA plots showed that the 4 samples in the nAVF group were still more heterogeneous compared to the 6 samples in the sham group (Fig. 3b, Supplementary Fig. S5).
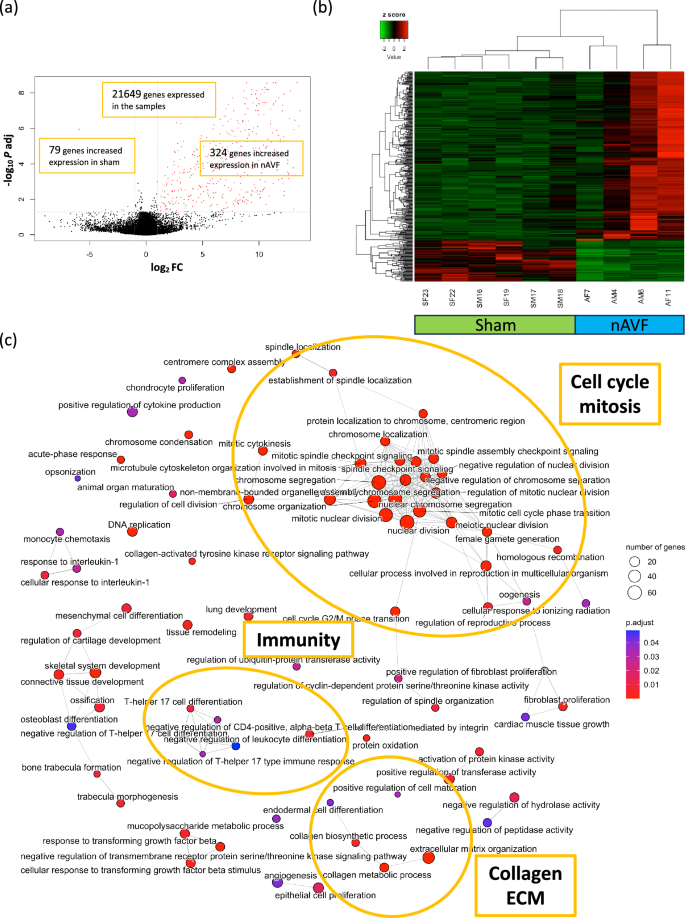
Differentially expressed genes (DEG) and gene ontology (GO) analyses between the sham and normal AVF (nAVF) groups. (a) Volcano plot of 21,649 genes expressed among the sham (n = 6) and nAVF (n = 4) samples. 403 genes were expressed differentially; genes (n = 324) with increased expression in the nAVF samples are in red dots, and genes (n = 79) with increased expression in the sham samples are in blue dots. (b) Heatmap plot of the 403 DEG. (c) Enrichment map plot of the 79 BP terms. Connected edges indicate mutually overlapping DEG sets. AVF arterio-venous fistula, IVC inferior vena cava, Log2FC logarithm of a fold change of nAVF vs Sham to base 2, P adj adjusted P value calculated by the Benjamini–Hochberg procedure, BP biological process, CC cellular component, MF molecular function.
GO enrichment analysis of the 403 DEG obtained from the comparison between the sham and nAVF groups identified 122 overrepresented GO terms that consisted of 79 BP terms, 19 CC terms and 24 MF terms. The top 10 BP, CC and MF terms with the lowest adjusted p values are shown in Supplementary Fig. S5. The enrichment map plot of the 79 BP terms showed that terms related to cell cycle and mitosis as well as terms related to immunity and the ECM were all increased in the nAVF group (Fig. 3c). Enrichment map plots of the 19 CC terms and the 24 MF terms showed that cell cycle and extracellular matrix including collagen were increased in the nAVF group (Supplementary Fig. S5). KEGG pathway enrichment analysis of the 403 DEG between the sham and nAVF groups identified 15 KEGG pathways as significantly overrepresented pathways (Table 2), including cell cycle (mmu04110), the p53 signaling pathway (mmu04115), as well as ECM-receptor interaction (mmu04512). These results suggest that the AVF in the nAVF samples showed homogenous expression of genes, at day 7, that could promote venous adaptive remodeling.
Subgroup analysis between the sham and OUT groups
To further understand the AVF in the OUT group, we compared the sham (n = 6) and OUT (n = 2) groups (Supplementary Fig. S6). Among the 22,163 genes, 701 genes were identified as DEG, setting the cutoff as |log2(Fold Change) |≥ 1 and adjusted p value < 0.05. Compared with the sham group, 667 genes out of 701 DEG were significantly upregulated, whereas 34 genes were significantly downregulated in the OUT group. The heatmap plot and the PCA plot showed that the OUT group was robustly clustered separately from the sham group. GO enrichment analysis of the 701 DEG rendered significantly overrepresented 302 GO terms including 198 BP terms, 25 CC terms and 79 MF terms. The top 10 BP, CC and MF terms with the lowest adjusted p values are shown in Supplementary Fig. S6. As seen in the enrichment map plot, some clusters of metabolic processes were formed. Terms related to coagulation and wound healing were also clustered. Terms of cell cycle and cell division were also distinct in the enrichment map plot of the top 150 BP terms. Although the AVF in the OUT group are distinct from the nAVF, these data suggest that the OUT are nonetheless undergoing adaptive remodeling to the fistula environment, and have increased number of genes regulated in the OUT compared to the nAVF (n = 701 vs. n = 403).
Integrating the subgroup analyses
To further understand the differences between the nAVF and OUT groups, we merged and reanalyzed the subgroup analysis comparing nAVF with OUT (Fig. 2, Table 1, Supplementary Figs. S3, S4) with the subgroup analysis comparing sham with nAVF (Fig. 3, Table 2, Supplementary Fig. S5) and the subgroup analysis comparing sham with OUT (Supplementary Fig. S6). First, we compared the 2 KEGG pathway analyses (nAVF vs. OUT, Table 1; sham vs. nAVF, Table 2). The complement and coagulation cascade (mmu04610) was the only common pathway that was consistently detected in both analyses. Comparing the OUT group with the nAVF group, F12, F11 and F9 in the intrinsic coagulation pathway were highly expressed in the OUT group (Supplementary Fig. S7). F10, F5, F2 and fibrinogen in the downstream common coagulation pathway were also upregulated in the OUT group. In addition, in the complement cascade, C4BP, C5 and the C6/7/8/9 complex were significantly increased in the OUT group compared to the nAVF group. Comparing the nAVF group with the sham group, no statistical difference was found among coagulation factors as well as among complement factors (Supplementary Fig. S7). Only F8, the most downstream coagulation factor in the intrinsic pathway, was downregulated in the nAVF group. Additionally, serine protease inhibitors (Serpins), which typically suppress the coagulation cascade32,33, showed increased expression in the nAVF group compared with the sham group. These data suggest that OUT show increased expression of complement and coagulation factors whereas nAVF do not.
We next integrated the DEG analysis data of the 4 comparisons between AVF and sham, nAVF and sham, OUT and sham, and OUT and nAVF (Table 3). To validate these results, we compared our previously published data directly examining these genes in the identical mouse AVF model. The AVF and nAVF groups showed small but not significant increases in Ephrin B2 and its receptor EphB4, markers of arteriovenous differentiation, consistent with previous reports of their increased expression19,20,34. CD44, CD68 and transforming growth factor-β (TGF-β), important immune response markers during the fistula maturation, were significantly increased in the AVF and nAVF groups; their increases on postoperative day 7 after the AVF creation had been reported previously20,22,23,26. Genes for collagen type I, type IV, type VIII and type XVIII, tissue inhibitor of metalloproteinase 1 (TIMP1), matrix metalloproteinase 2 (MMP2) and elastin also showed significantly more expression in the AVF and nAVF groups compared to the sham group. Upregulation of these molecules on day 7 were also observed previously23. Regarding declining changes, NADH: ubiquinone oxidoreductase (NDUF), vascular endothelial growth factor A (VEGF-A) and programmed death-ligand 1 (PD-L1) were significantly decreased in the AVF group, and these were also previously reported (day 7)26,28,31. The OUT group also showed similar changes compared with the sham group. Therefore, these increases and decreases of gene expression in the AVF, nAVF and the OUT groups are consistent with previously published data.
Nevertheless, compared with the nAVF group, the OUT group showed negative log2 (Fold Change) in many genes where the AVF and nAVF groups showed increases concordant with the published data (Table 3), such as most of the collagen genes, although no statistical significance was observed. On the other hand, the OUT group, when compared with the nAVF group, showed relatively increased expression of many genes upregulated in the whole AVF group, suggesting attenuated regulation of gene expression in the OUT group. In toto, these data suggest that the AVF in the OUT group have a different pattern of adaptive remodeling in the fistula environment compared to both the nAVF group as well as previous published data, e.g., the OUT group are not characterized by the same adaptive venous remodeling as present in the nAVF group.
Subgroup analysis between female and male AVF
To determine whether sex differences in gene expression were present in the AVF group, we performed a subgroup analysis between the female AVF samples (n = 3) and the male AVF samples (n = 3). With the cutoff as |log2(Fold Change) |≥ 1 and adjusted p value < 0.05, only 24 DEG consisting of 12 upregulated genes and 12 downregulated genes were identified. To avoid missing important differences in gene expression, we lowered the threshold level for the fold change from 2.0 times to 1.5 times, that is |log2(Fold Change) |≥ 0.585. Even with this threshold change, only 49 genes were differentially expressed, with 29 genes upregulated, and 20 genes downregulated in the female AVF (Fig. 4a). As expected, 2 genes out of the 29 genes expressed greater in the female AVF were present on the X chromosome, and 5 of the 20 genes less expressed in the female AVF were present on the Y chromosome (Supplementary Table S4). The heatmap plot and PCA plot of the 49 DEG showed that no prominent homogeneity was observed in either group (Fig. 4b, Supplementary Fig. S8). GO enrichment analysis of the 49 DEG showed that 63 GO terms were statistically significant, with 47 terms belonging to BP, 8 terms belonging to CC and 8 terms belonging to MF. Among the top 10 BP terms with the lowest adjusted p values, 8 CC terms and 8 MF terms are shown in Fig. 4c. Enrichment map plots of the 3 ontology subgroups are shown in Supplementary Fig. S8. These data are consistent with very few differences in gene expression detectable between patent female and male AVF on postoperative day 7.
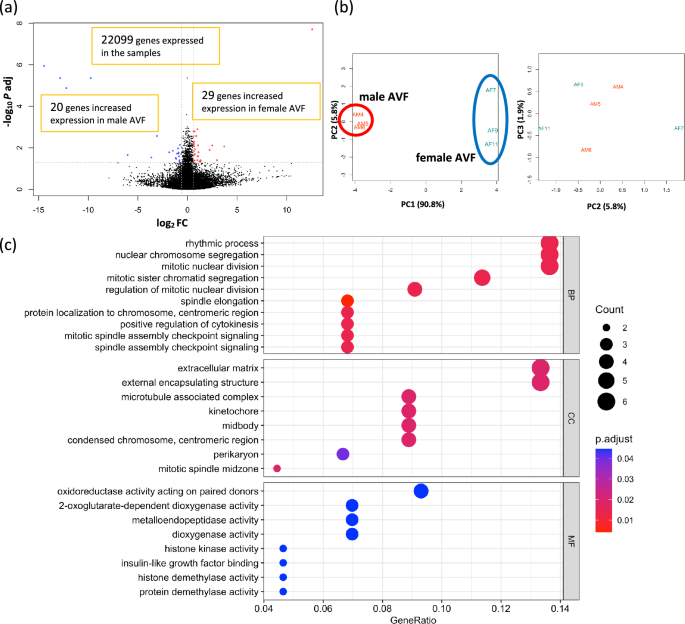
Differentially expressed genes (DEG) and gene ontology (GO) analysis between the female and male AVF. (a) Volcano plot of 22,099 genes expressed among the female (n = 3) and male (n = 3) AVF samples. 49 genes were expressed differentially; genes (n = 29) with increased expression in the female AVF samples are in red dots, and genes (n = 20) with increased expression in the male AVF samples are in blue dots. (b) Principal component analysis (PCA) plot of the 6 AVF samples grouping the 49 DEG. The 3 female AVF samples are circled in blue; the 3 male AVF samples are circled in red. (c) GO enrichment analysis. 63 GO terms were significantly overrepresented among the 49 DEG. AVF arterio-venous fistula, Log2FC logarithm of a fold change of the female AVF vs the male AVF to base 2, P adj adjusted P value calculated by the Benjamini–Hochberg procedure, PC principal component, BP biological process, CC cellular component, MF molecular function.
- The Renal Warrior Project. Join Now
- Source: https://www.nature.com/articles/s41598-024-64075-8