Study design
The metabolomics study design included 10 mice per group for each of the 7 experimental groups, which have been previously published6,15: (1) normal (no surgical procedure), (2) 4 h sham, (3) 4 h AKI, (4) 24 h sham, (5) 24 h AKI, (6) 7 day sham, and (7) 7 day AKI. However, 1 mouse in the 7-day sham group died, and 4 mice in the 7-day AKI group died. Thus, the numbers of animals included in the final analysis are as follows: (1) normal: n = 10, (2) 4 h sham: n = 10, (3) 4 h AKI: n = 10, (4) 24 h sham: n = 10, (5) 24 h AKI: n = 10, (6) 7 day sham: n = 9, and (7) 7 day AKI: n = 6. The accompanying plasma, kidney, heart, lung metabolomics results have been previously reported6,15.
Glutathione and ATP depletion in the liver are most severe at 24 h after AKI
To assess kidney function after AKI, serum creatinine and BUN were determined in normal mice and at 4-h, 24-h and 7-days after sham and AKI procedures as previously described6,16. As shown in Fig. 1A, serum creatinine was significantly increased 4 and 24 h after AKI versus sham. There was no significant difference in serum creatinine at 7 days. BUN was significantly increased in AKI at all three time points (Fig. 1B). (The serum creatinine and BUN data in this cohort of mice have been previously published6.)
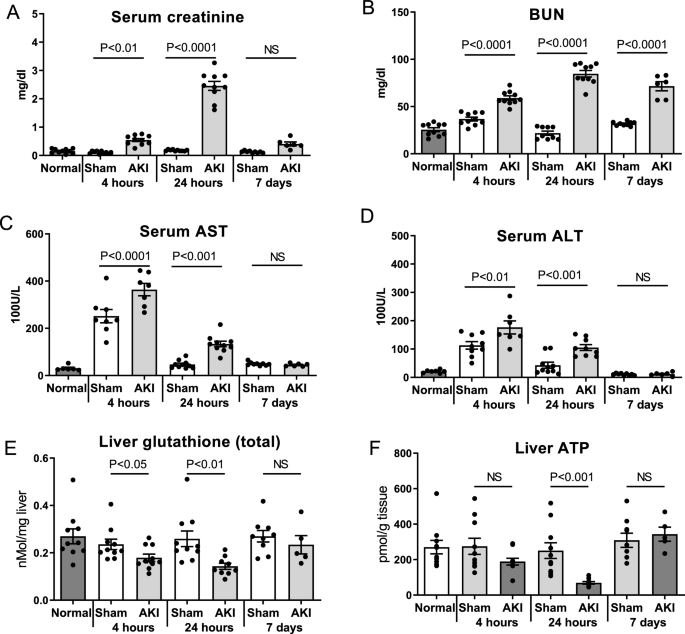
Time course of AKI and hepatic effects after ischemic AKI. Wild type mice were examined 4 h, 24 h, and 7 days after sham surgery (Sham) and surgery to induce ischemic AKI (AKI). Normal mice were also studied. Renal function was assessed by (A) Serum creatinine and (B) Blood urea nitrogen (BUN) (The serum creatinine and BUN data from this cohort of mice have been previously published)6,15. Hepatic effects were assessed by (C) Serum AST, (D) Serum ALT, (E) Liver glutathione (total) levels, and (F) Liver ATP. Data are mean ± SE; statistics by Student’s t-test comparing Sham versus AKI at each time point; n = 6–10 per group.
Serum AST and ALT, clinical markers of hepatic stress, were significantly increased 4 and 24 h after AKI versus sham (Figs. 1C,D). Liver levels of glutathione, the most abundant antioxidant and an essential cofactor for the enzyme systems that combat reactive oxygen species (ROS), were significantly decreased at 4- and 24-h post-AKI (Fig. 1E), suggestive of increased oxidative stress in the organ. To assess energy production in the liver after AKI, liver ATP levels were determined. Liver ATP levels were trending lower 4 h after AKI and were significantly lower 24 h after AKI (Fig. 1F).
Hepatic mitochondrial function, superoxide production, and liver histology are normal after AKI
Since inflammation is associated with oxidative stress and reduced hepatic levels of glutathione, we assessed liver myeloperoxidase (MPO) activity; MPO activity is a sensitive marker of neutrophil infiltration. Liver MPO activity at 4 and 24 h was similar after sham and AKI, and not statistically significant compared to normal mice (Fig. 2A) (liver MPO activity at 7 days was similarly not statistically significant after sham or AKI—data not shown).
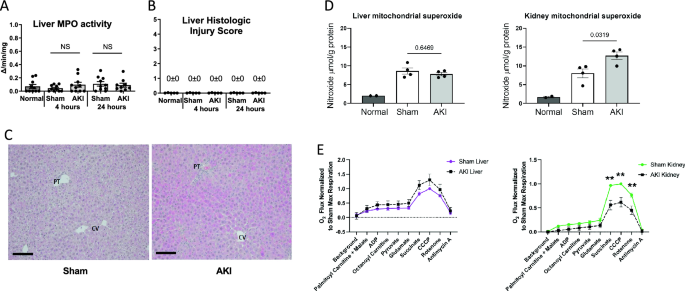
Liver MPO activity, histology, superoxide, and mitochondrial respiration after AKI. To assess whether AKI included liver inflammation, injury, elevated reactive oxygen species (ROS), or mitochondrial dysfunction, (A) liver MPO activity, (B, C) liver histology, (D) liver superoxide, and (E) mitochondrial respiration were assessed in the liver and were unchanged versus sham in all cases. In contrast, kidney mitochondrial superoxide increased, and kidney mitochondrial respiration was suppressed. Mitochondrial superoxide was assessed with electron paramagnetic resonance (EPR) spectroscopy. Mitochondrial function (O2 flux) was measured by the Oroboros O2K respirometer and the substrates added to the chamber are listed. Significant differences between mitochondrial oxygen consumption were found in the kidney using the substrates succinate, CCCP and rotenone, indicating a defect in complex II during AKI. Data are mean ± SE; statistics by Student’s t-test comparing Sham versus AKI at each time point; n = 6–10 per group, **p < 0.01.
To further assess the effect of AKI on the liver, we examined liver histology, which was scored using a composite injury score that included inflammation, cell injury (including necrosis), steatosis, and fibrosis. As shown in Fig. 2B, both sham and AKI scored 0 ± 0 for histologic injury at 4 and 24 h post AKI. Representative histology for sham and AKI at 24 h is shown in Fig. 2C. Slight reactive changes were noted for two of the eight AKI samples as shown in Supplementary Fig. S1). These reactive changes may be associated with liver “stress”, but are not indicative of cell injury, cell death, or inflammation.
Since liver inflammation and injury were absent, we examined hepatic levels of superoxide, the most abundant reactive oxygen species (ROS), to assess whether elevated levels could explain the reduced levels of hepatic glutathione. As shown in Fig. 2D, mitochondrial superoxide was similar in the liver after sham and AKI at 24 h (similar results were observed in the liver 4 h after AKI, data not shown). In contrast, superoxide levels were significantly increased in the kidney 24 h after AKI.
To investigate whether mitochondrial dysfunction could explain the reduced levels of glutathione and ATP in the liver, we assessed mitochondrial respiration. As shown in Fig. 2E, mitochondrial respiration was normal in the liver 24 h after AKI. In contrast, mitochondrial respiration was significantly suppressed in the kidney.
In sum, these data indicate that our model of ischemic AKI is associated with hepatic stress as judged by elevated liver enzymes, depletion of glutathione, and reduced ATP levels. Remarkably, these effects occur in the absence of histologic liver injury, hepatic cell death, neutrophil or other inflammatory cell accumulation, excess ROS, or abnormal mitochondrial function.
Metabolomic analysis and hierarchical clustering analysis of the liver
To characterize the effect of ischemic AKI on energy metabolism, untargeted UHPLC-MS-based metabolomics analysis of the liver was performed and resulted in the measurement of 141 annotated metabolites in central energy metabolism. Univariate ANOVA (without post hoc testing) revealed that 100 (71%) of the original 141 metabolites were significantly different among experimental groups. Analyte F-value, P-value, and Benjamini–Hochberg FDR can be found in Supplementary Table S1. Analytes with the most significant ANOVA corrected p-values were 2′,3′-cyclic CMP, phosphocreatine, glucuronic acid, creatine, citrulline, ethanolamine phosphate, allantoin, and pantothenate. A principal component analysis (PCA) of all liver samples from untargeted metabolomics, including normal, sham, and AKI at 4 h, 24 h, and 7 days after surgery as well as quality control samples and blank controls can be found in Supplementary Fig. S2.
To identify and visualize trends among experimental groups, these 100 metabolites are presented via hierarchical clustering analysis (HCA) (Fig. 3). Broadly speaking, the HCA heat map demonstrates that the 24-h AKI group has the most distinct metabolic phenotype with approximately 2/3 of the metabolites relatively decreased compared to other groups and approximately 1/3 of the metabolites relatively increased compared to other groups.
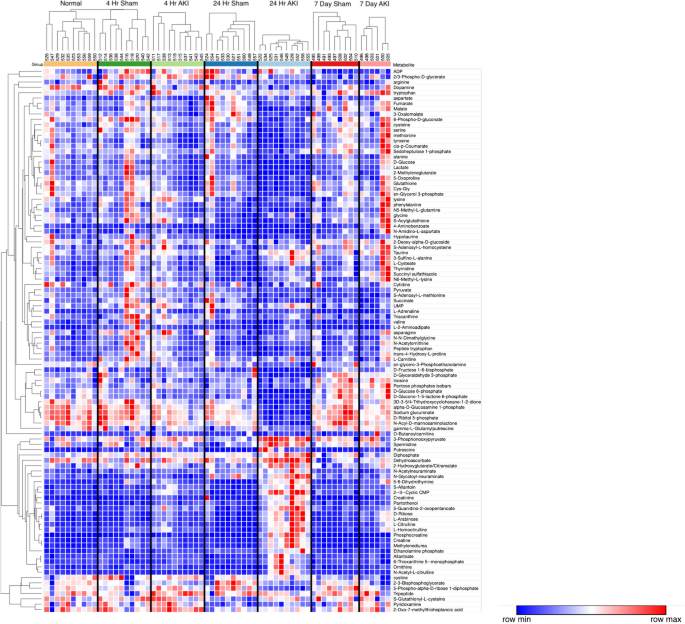
Hierarchical clustering analysis (HCA) of liver metabolites. HCA with predefined sample clusters, was performed for the 102 metabolites that were significantly different among groups as judged by ANOVA (without post hoc testing) to determine trends for individual metabolites among experimental groups. Each column cluster represents an experimental cohort as labeled (Normal, 4-h sham, 4-h AKI, 24-h sham, 24-h AKI, 7-day sham and 7-day AKI), whereas each individual column represents an experimental mouse subject (Normal: n = 10, 2 4 h sham: n = 10, 4 h AKI: n = 10, 24 h sham: n = 10, 24 h AKI: n = 10, 7 day sham: n = 9, and 7 day AKI: n = 6). Each row represents a metabolite. To the right of each row is the corresponding metabolite name. Red represents increased metabolite level whereas blue represents decreased metabolite level. The correlation metric used was the Pearson (n-1) correlation with an average linkage method. The major effect observed is for the 24-h AKI group which is characterized by metabolites that are both relatively decreased versus other groups (in blue, upper 2/3 of heat map) as well as increased levels versus other groups (in red, lower 1/3 of heat map).
Only 5 analytes were significantly different at all three time points (i.e., 4 h, 24 h, and 7 days). All higher in AKI, these included citrulline, allantoin, ribose, arabinose, and (as expected in AKI) creatinine. Comparisons were then made between sham and AKI for each time point separately: 15% (n = 21/141) were significantly different at 4 h; 52% (n = 73/141) were significantly different at 24 h, and 23% (n = 33/141) were significantly different at 7 days. Thus, most analytes with significantly different concentrations were found at the 24-h time point, consistent with the HCA heatmap.
Pathway enrichment analysis demonstrates that energy metabolism, the urea cycle, and glutathione metabolism are impacted in the liver after AKI
Next, pathway enrichment analysis was performed using analytes that were significantly different at the 24-h time point. Analysis revealed enrichment for three major pathway groups (1) energy metabolism, (2) the urea cycle, and (3) cysteine and glutathione metabolism (Figs. 4A, 5A and 6A, respectively). Analytes and pathways of greatest significance, as well as p-value, FDR, and fold change for liver analytes measured at 24 h, can be found in Supplementary Tables S1 and S3, respectively, and are described in detail below.
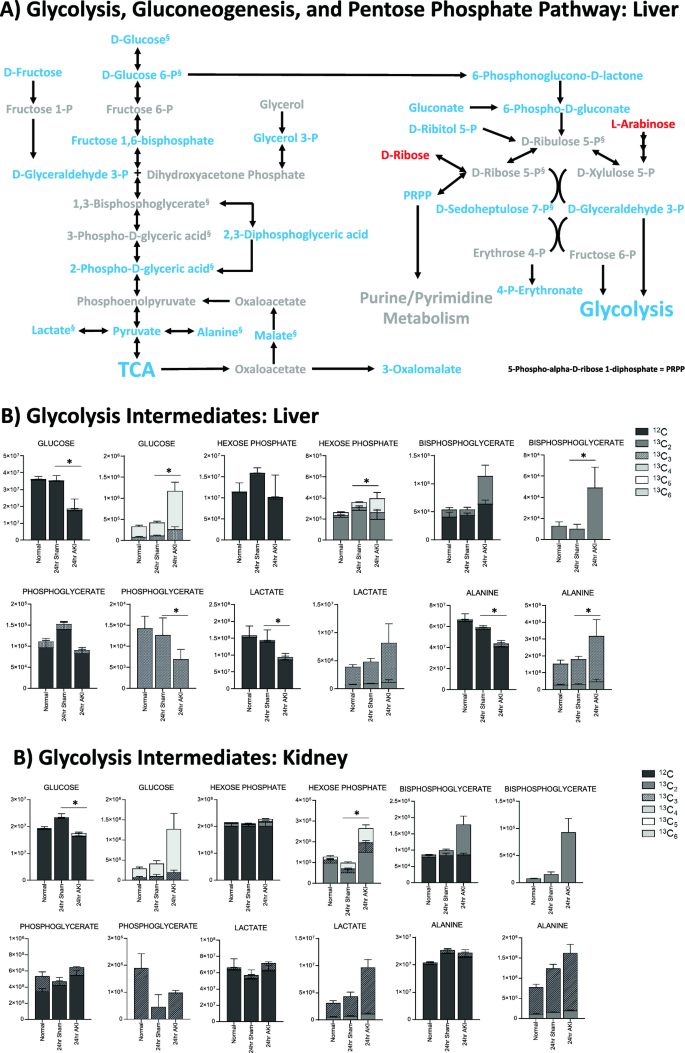
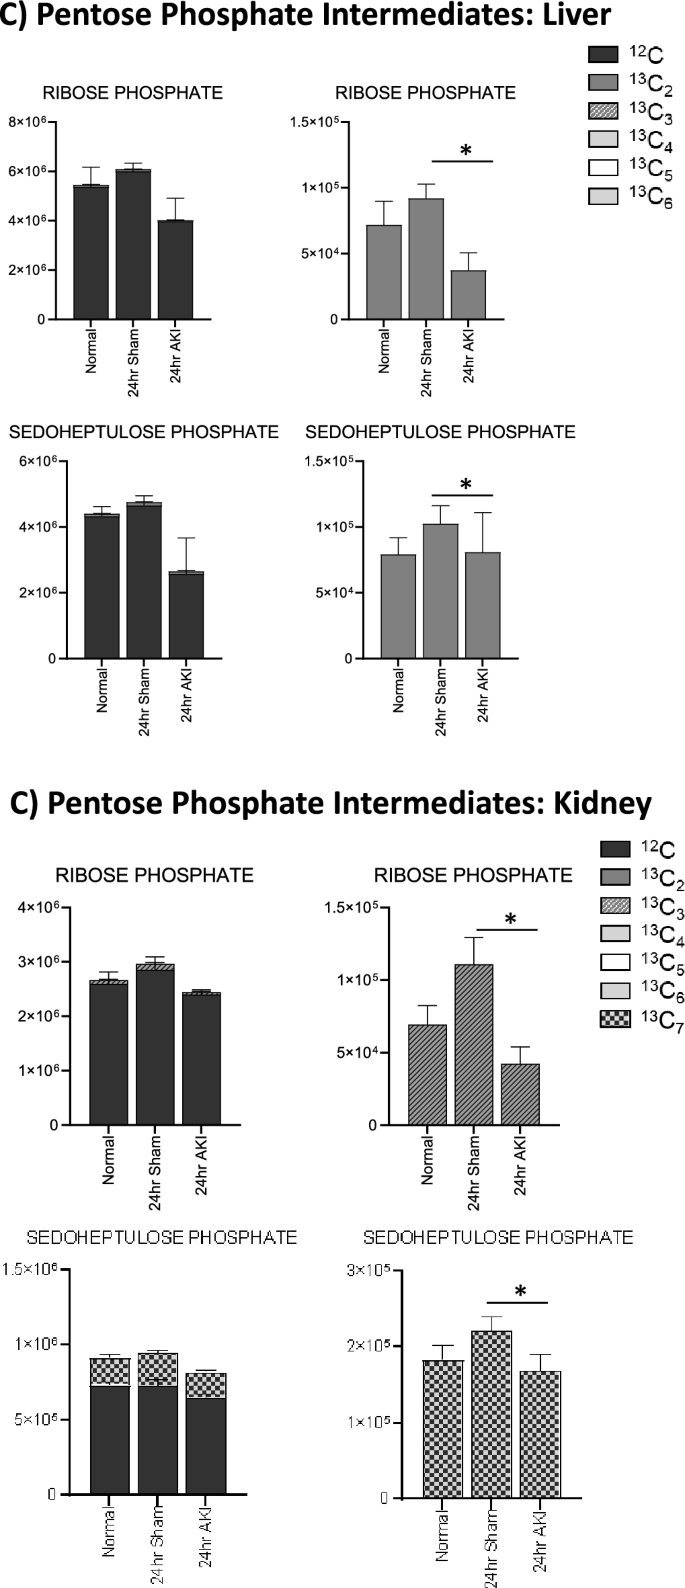
Pathway enrichment and flux analysis reveals that glycolysis, gluconeogenesis, and pentose phosphate pathway in the liver and kidney are impacted 24 h after AKI. (A) Pathway diagram including Glycolysis, Gluconeogenesis, and Pentose Phosphate Pathway, illustrating steady state and labeled carbon study results in liver. Metabolites higher (red) or lower (blue) in AKI versus Sham mouse livers at 24 h post-procedure. Analytes in gray were detectable but not significantly different in AKI versus Sham. Analytes in black were not detectable through metabolomic analysis. Differences found in labeled carbon studies are designated by §. (B) Labeled carbon study results for Glycolysis and Gluconeogenesis intermediates in liver and kidney. (C) Labeled carbon study results for Pentose Phosphate Pathway intermediates in liver and kidney. For (B) & (C), y-axes represent peak areas (arbitrary units). For both liver and kidney, n = 8 Sham, n = 8 AKI. P-value < 0.05 (*) in Sham vs AKI. Data can be found in Supplementary Tables S6 and S7, respectively.
Pathway enrichment and flux analysis reveals that the TCA and urea cycles in the liver and kidney are impacted 24 h after AKI. (A) Pathway diagram including tricarboxylic acid (TCA) and urea cycles, illustrating steady state and labeled carbon study results in liver. Metabolites higher (red) or lower (blue) in AKI versus Sham mouse livers at 24 h post-procedure. Analytes in gray were detectable but not significantly different in AKI versus Sham. Analytes in black were not detectable through metabolomic analysis. Differences found in labeled carbon studies are designated by §. (B) Labeled carbon study results for TCA Intermediates in liver and kidney. (C) Labeled carbon study results for TCA-related Amino Acids in liver and kidney. For (B) and (C), y-axes represent peak areas (arbitrary units). For both liver and kidney, n = 8 Sham, n = 8 AKI. P-value < 0.05 (*) in Sham vs AKI. Data can be found in Supplementary Tables S6 and S7, respectively.
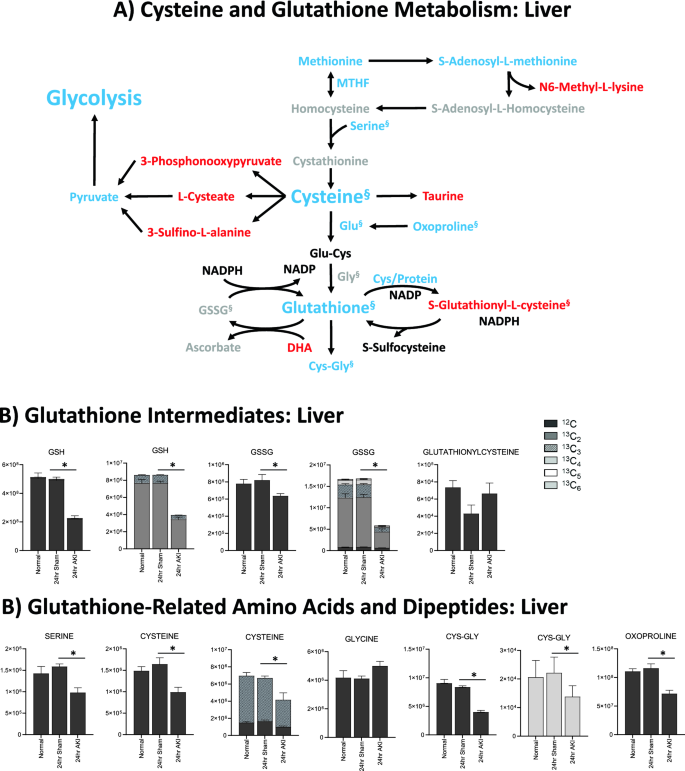
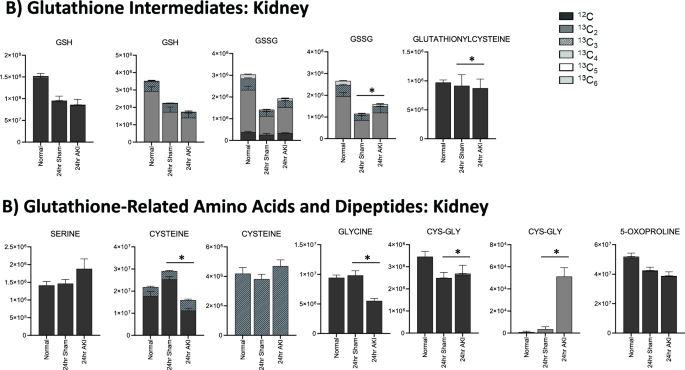
Glutathione is depleted in the liver and kidney 24 h after AKI, but the kidney has more glutathione intermediates available than the liver. (A) Pathway diagram including Cysteine and Glutathione Metabolism, illustrating steady state and labeled carbon study results in liver. Metabolites higher (red) or lower (blue) in AKI versus Sham mouse livers at 24 h post-procedure. Analytes in gray were detectable but not significantly different in AKI versus Sham. Analytes in black were not detectable through metabolomic analysis. Differences found in labeled carbon studies are designated by §. (B) Labeled carbon study results for Glutathione Intermediates, including Amino Acids and Dipeptides in liver and kidney. y-axes represent peak areas (arbitrary units). For both liver and kidney, n = 8 Sham, n = 8 AKI. P-value < 0.05 (*) in Sham vs AKI. Data can be found in Supplementary Tables S6 and S7, respectively.
Energy metabolism
The energy metabolism pathways affected include glycolysis, gluconeogenesis, the pentose phosphate pathway, and the tricarboxylic acid (TCA) cycle. Energy metabolites were nearly all lower in AKI versus sham, as is illustrated in Figs. 4A and 5A. Some of the lowest fold changes (fc = AKI/sham) were observed in D-glucose 6-phosphate (fc = 0.12), fructose 1,6-bisphosphate (fc = 0.21), and D-glyceraldehyde 3-phosphate (fc = 0.22), proximal key intermediates of glycolysis (Supplementary Table S3).
Labeled carbon studies (Figs. 4B,C and 5B,C, Supplementary Table S6) indicate lower total levels and increased intracellular uptake of labeled glucose in AKI versus sham (Fig. 4B). Flux through glycolysis is higher in AKI, as reflected by lower labeled phosphoglycerate, a glycolysis intermediate, and lower amounts of total with higher concentrations of labeled (or metabolized) alanine and lactate, glycolysis end-products (Fig. 4B). There were lower steady state levels of total analyte and higher flux (reflected by lower labeled species) through the pentose phosphate pathway (Fig. 4C). Malate, fumarate, succinate, and alpha-ketoglutarate in the TCA cycle were all lower in AKI versus sham (Fig. 5B), with lower levels of labeled species indicating increased flux through the TCA cycle, and lower overall intermediate availability. TCA-associated amino acids including aspartate, glutamine, glutamate, and alanine were generally found to be in lower concentration in AKI (Fig. 5A and C). Labeled carbon studies demonstrated variability in higher versus lower concentrations of labeled species in these amino acids, likely reflecting the complexity and dynamics of amino acid metabolism in multiple interacting pathways. Mean relative levels of liver analytes in sham and AKI cohorts, fold change, and p-values are found in the Supplementary Table S6. These data, taken together with the significant reduction in liver ATP levels observed at 24 h post-AKI (Fig. 1F), and the unchanged rate of oxidative phosphorylation (Fig. 2E), suggests greater consumption of ATP than the liver can generate.
The urea cycle
Urea cycle intermediates, including intermediates in arginine/ornithine metabolism such as putrescine, spermidine, creatinine, creatine, and phosphocreatine were uniformly higher in AKI versus sham in the liver at 24 h (Fig. 5A). Remarkably, the greatest fold change was seen in phosphocreatine (fc = 58.7), followed by citrulline (fc = 11.7), creatinine (fc = 6.8), N-acetyl-L-citrulline (fc = 6.4), creatine (fc = 6.2), and L-homocitrulline (fc = 6.1) (Supplementary Table S3). These data are consistent with the significantly increased levels of urea observed 24 h post-AKI (Fig. 1B), and likely indicate increased amino acid catabolism and resultant net positive nitrogen balance. They may also be indicative of tissue damage, though this is unlikely as whole cell damage was not seen histologically in liver.
Glutathione metabolism
Glutathione-related metabolites were generally decreased in AKI versus sham (Fig. 6A). Glutathione (GSH) was significantly decreased in AKI, both at steady state and in the tracing studies, consistent with the significantly lower level of total glutathione observed 24 h post AKI (Fig. 1E). 13C–labeled GSH (Fig. 6B) was also lower in the liver in AKI versus sham, indicating decreased production, increased consumption, or increased export out of the liver. Cysteine, a direct and crucial component of glutathione synthesis, and cysteine/glutathione related analytes 5,10-methylene tetrahydrofolate (MTHF), S-adenosylmethionine (SAM), serine, and oxoproline were all lower in AKI (Fig. 6A). Labeled species were also lower in AKI (Fig. 6B), suggesting generally reduced production of these precursor analytes. Products of cysteine metabolism including taurine, 3-phosphonooxypyruvate, cysteic acid (cysteate), and 3-sulfino-L-alanine were higher in AKI indicating increased cysteine consumption, separate from glutathione synthesis (Fig. 6A). Interestingly, glutathionyl-cysteine was also higher in AKI, suggesting increased GSH consumption by glutathionylation (Fig. 6A,B).
In summary, metabolomic pathway analysis and labeled carbon studies demonstrate that, 24 h after AKI, the liver is characterized by energy deficiency, glutathione deficiency, glutathione precursor deficiency, and upregulated urea cycle metabolism. Energy deficiency is accompanied by reductions in and apparent increased consumption/metabolism of glycolytic, TCA, and PPP intermediates. Lower glutathione levels are accompanied by reduced availability of precursors (primarily cysteine) and increased downstream metabolites of glutathione precursors (primarily cysteine-related, non-glutathione metabolites).
Kidney metabolomic analysis at 24 h demonstrates similarities to impacted pathways, but differences in intermediate availability, compared to the liver
Based on findings in liver metabolites at 24 h, we analyzed kidney tissue metabolites at 24 h in AKI versus sham mice1. In total, there were 90 of 177 detected metabolites (51%) that met significance by p-value and FDR (Supplementary Table S4). Pathway enrichment analysis in the kidney is compared with liver pathway enrichment in Fig. 7. Kidney pathway analysis demonstrated enrichment for glutathione and cysteine related metabolism and urea cycle and arginine related metabolism, much like those found in the liver (Supplementary Table S5). Unlike the liver, energy related pathways including glycolysis, PPP, and the TCA cycle were not enriched. Generally, analytes in the glutathione and cysteine pathways were lower in AKI versus sham (notably cysteine, gamma-glutamyl-cysteine, homocysteine, S-adenosylhomocysteine (SAH), and methionine). Total glutathione was not significantly different between AKI and sham1. As in liver, those analytes related to nitrogen balance, arginine, and the urea cycle (notably citrulline, homocitrulline, N-acetylcitrulline, guanidinosuccinic acid, putrescine, creatine, creatinine, phosphocreatine, 2-oxoarginine, guanidinoacetate, arginine, ornithine, and carglumic acid) were higher in AKI compared with sham.
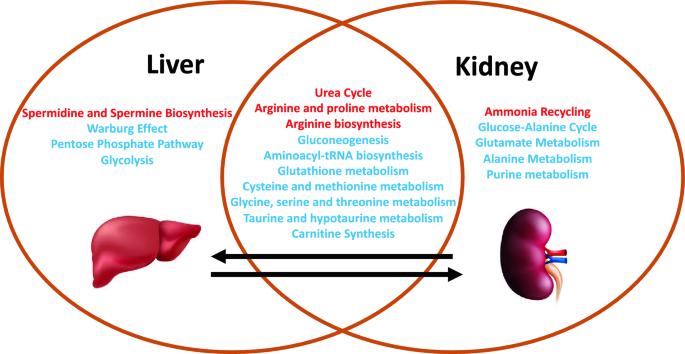
Comparison of affected metabolic pathways in the liver versus kidney 24 h after AKI. Venn diagram demonstrating similarities and differences in pathway enrichment in liver and kidney. Generally, enriched pathways demonstrated higher (red) or lower (blue) metabolite concentrations in AKI versus Sham at 24 h post-procedure.
Kidney labeled carbon analysis at 24 h supports greater pools of intermediates in AKI compared with the liver
In labeled carbon analyses, we compared kidney metabolites to liver metabolites. In glycolysis (Fig. 4B), generally, labeled carbon species including hexose phosphate, bisphosphoglycerate, lactate, and alanine were higher in AKI versus sham, indicating increased flux through the glycolytic pathway in both liver and kidney. Interestingly, in the kidney, total concentrations of analytes (including light, unlabeled species) were higher in AKI than sham, whereas in the liver they were lower in AKI. This reflects a greater abundance of energy resources available in the kidney. Analytes from the pentose phosphate pathway (Fig. 4C) demonstrated lower total and labeled species in AKI compared to sham in both the liver and kidney.
TCA cycle intermediates were generally higher (both total and labeled) in the AKI versus sham kidney (Fig. 5B), particularly fumarate and malate. This is opposite the pattern seen in the liver, and again suggests that there are more abundant energy intermediates in the AKI kidney compared to the liver. TCA-related amino acids (Fig. 5C) were variable in both tissues, with no clear unifying pattern. Mean relative levels of kidney analytes in sham and AKI cohorts, fold change, and p-values are found in the Supplementary Table S7.
Finally, in the liver, total and oxidized glutathione were both lower in AKI versus sham; in the kidney, however, total glutathione is similar in AKI versus sham, and oxidized glutathione is higher in AKI compared to sham (Fig. 6B). This suggests that, whereas in the AKI liver glutathione is generally depleted, in the AKI kidney there is no loss of glutathione, and glutathione is being appropriately oxidized in the setting of stress. This is consistent with pathway and general metabolomic analyses. In the kidney, glutathione precursors are higher in AKI versus sham, whereas in the AKI liver they are lower. This, again, suggests that crucial resources in both energy metabolism and oxidative stress mitigation are more available in the AKI kidney compared to the AKI liver.
- The Renal Warrior Project. Join Now
- Source: https://www.nature.com/articles/s41598-024-64586-4