Aurka knock-out prevents cystogenesis
To examine Aurka’s role in regulating renal epithelial homoeostasis we crossed Aurka floxed mice (Aurkaf/f)21 with B6.Cg-Tg(Hoxb7-cre)Amc animals (cre)34 to inactivate the gene in collecting ducts (AurkaΔ/Δ). In control kidneys, expression of AURKA was detected infrequently at postnatal day 4 (P4) (Fig. S1a). Gene deletion in AurkaΔ/Δ mice was confirmed by immunostaining and PCR analysis, and the animals were born at normal Mendelian ratios, with no evidence of renal pathology at P0, P21, and P150 (Fig. S1b, c, d). Whilst their kidneys were slightly smaller at P0, this difference was not found later (Fig. S1e) and the only abnormality seen was a low incidence of hydronephrosis (Fig. S1f, 7%, n = 68). Such animals were excluded from further study. Analysis of ureteric bud morphogenesis by Optical Projection Tomography35 at embryonic day 14.5 (E14.5) found no overt structural differences in ureteric bud branching (Fig. S1g) or in other measures of ureteric tree morphology (Fig. S1h–l). Taken together, these results demonstrate that AURKA is largely dispensable for the development and homoeostasis of the renal collecting duct system, despite the high levels of cell proliferation in this tissue36.
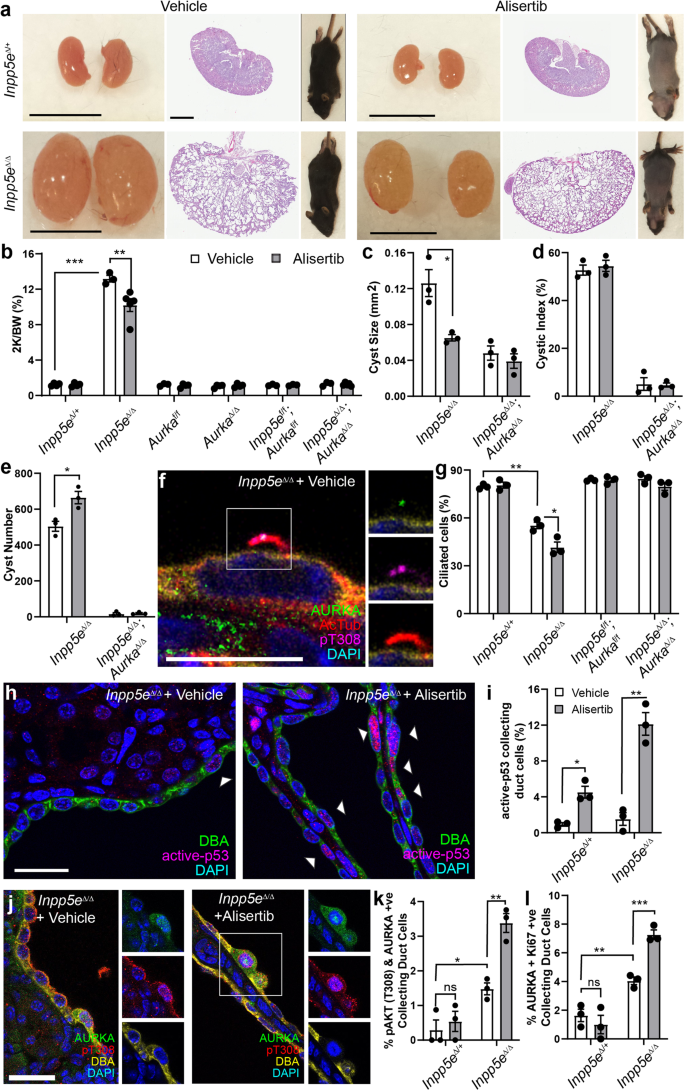
To establish an in vivo model of JS in which to study the role of AURKA, Inpp5e floxed mice (Inpp5ef/f)13,14 were crossed with Hoxb7-cre animals to generate progeny lacking Inpp5e in collecting ducts (Inpp5eΔ/Δ). Consistent with previous studies using the renal epithelia-specific Ksp-cre14, we observed rapid and comparatively more severe development of collecting duct-derived cysts (Fig. 1a) which limited animal survival to 17-21 days. By P21 AURKA expression was limited to a rare collecting duct cells in wild-type mice, but cyst development was associated with an increase in cells expressing AURKA (Fig. S1m). Mice were then crossed to generate Inpp5eΔ/Δ; AurkaΔ/Δ animals and intermediate genotypes. Inpp5e∆/∆;Aurka∆/+ mice were indistinguishable from Inpp5e∆/∆ mice (Fig. 1b–d). In contrast to Inpp5e∆/∆ mice, double mutant kidneys exhibited normal size and outward appearance (Fig. 1a). At P21, the cystic index of the organ was significantly reduced (Fig. 1b) and cyst number decreased by ~90% (Fig. 1c, from averages of 381 to 38). While a small number of residual cysts of a size equivalent to those of Inpp5e∆/∆ mice were observed in double mutant mice (Fig. 1d), these exhibited persistent expression of AURKA (Fig. S1m, n), indicating that these cysts derive from cells in which Aurka has not been deleted. Analysis of the numbers of AURKA+ cells in mice of different genotypes confirmed cre activity and reflect the presence of breakthrough cysts characterised by persistent AURKA expression (Fig. S1n). Cre only and other control animals exhibited no cysts.
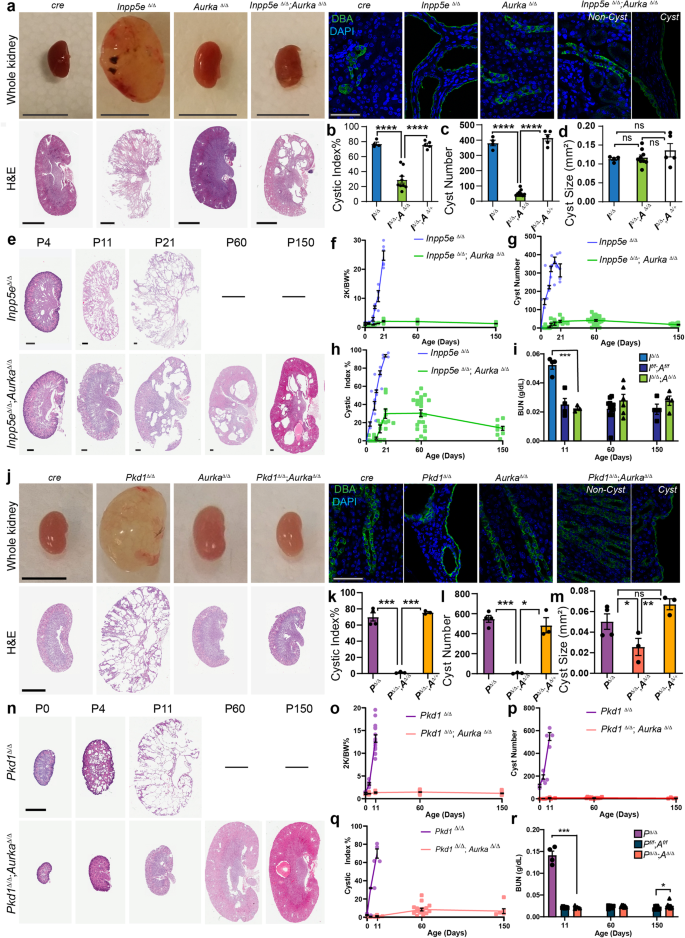
a, j Images of mouse kidneys from indicated genotypes (bar = (A) 1 cm (whole organs); j = 0.5 cm; 2 mm (for H&E sections); 50 μm (for immunostains)). b, k cystic index (Inpp5e p values for pairs indicated from left to right; p = 8.7 × 10⁻⁷, p = 9.3 × 10⁻⁷ and Pkd1 p values; p = 3.9 × 10⁻⁴, p = 4.1 × 10⁻⁶). c, l average cyst number per cross-section number of cysts (Inpp5e p values for pairs indicated from left to right; p = 4.6 × 10⁻⁵, p = 7.5 × 10⁻⁶, and Pkd1 p values; p = 2.6 × 10⁻⁴, p = 0.0122). d, m average cyst cross-sectional size (Pkd1 p values for pairs indicated from left to right; p = 0.0419 and p = 0.0094). e, n Kidney sections of indicated genotypes of increasing age. e bars = 0.4 mm and n = 4 mm. f–h and o–q Plot of kidney-to-body-weight ratio, cyst number and cystic index of indicated mice over time. i, r Blood Urea Nitrogen (BUN) assessment of kidney function with age (Inpp5e p values indicated = 0.0003, Pkd1 p values for pairs indicated from left to right p = 0.0005, p = 0.0490). All graph data indicate mean ± S.E.M. a–e Mice were P17–P21 days of age. j–o Mice were P11 days of age. Graph abbreviations that apply throughout I Inpp5e, P Pkd1, A Aurka, ns not significant. a–d n = 4–9, e–h n = 3–24, i n = 4–12, j–m n = 3–4, n, p–q n = 3–16, o n = 3–34, r n = 4–9. Cysts were not present in the kidneys of other mouse genotypes and are omitted from cyst size, number and index graphs. Additional data in Figs. S1 and S2. Exact n and data point values provided in supplementary material- Source Data File.
To investigate the capacity of Aurka deletion to prevent the development of PKD over time, we analysed Inpp5eΔ/Δ; AurkaΔ/Δ mice up to 150 days of age (Fig. 1e). Staining with markers to different nephron segments found that most cysts had collecting duct identities consistent with cre expression (Fig. S1o). Double mutant animals maintained normal kidney-to-body-weight ratios (Fig. 1f) with no increase in the number of cysts (Fig. 1g), cystic index (Fig. 1h) or size (Fig. S1p). Over time the number of cysts reduced slightly as did the cystic index, possibly as a result of eventual Cre mediated Aurka deletion, a question we formally examine later in this article. Assessment of renal function by measurement of blood urea nitrogen (at P11, -60 and -150; Fig. 1i) or urinary albumin creatinine ratios at P21 (Fig. S1q) showed a complete normalisation of these parameters relative to controls. These studies propose Aurka an obligate regulator of renal cyst development in Joubert Syndrome.
We next examined whether AURKA also contributes to cyst development in ADPKD downstream of POLYCYSTIN mutations. Pkd1∆/∆ mice were generated using the same Hoxb7-cre driver, resulting in extensive collecting duct-derived cysts (consistent with other studies37) requiring euthanasia at postnatal day 11 (P11)(Fig. 1j). Consistent with prior studies32, these structures were associated increased expression of AURKA (Fig. S2a–e). Pkd1∆/∆ kidneys had significantly increased cystic index (Fig. 1k), cyst number (Fig. 1l), and size (Fig. 1m). Conditional deletion of Aurka in Pkd1∆/∆ mice (confirmed by reduction in AURKA expression (Fig. S2c)) resulted in an almost complete suppression of cyst formation. Double mutant kidneys were of similar size and outward appearance to controls (Fig. 1j) and had a reduced cystic index (Fig. 1k) driven by a 98.9% decrease in cyst number (Fig. 1l) and a reduction in the size of the few remaining cysts (Fig. 1m). Pkd1∆/∆;Aurka∆/+ mice were indistinguishable from Pkd1∆/∆ mice (Fig. 1k–m) and the few residual cysts in double mutant kidneys again demonstrated persistent expression of AURKA (Fig. S2d), indicating that they likely arise from incomplete cre activity.
To examine the long-term effects of Aurka deletion on ADPKD progression, we examined Pkd1∆/∆;Aurka∆/∆ at P11, P60 and P150 and found them to be of normal size and outward appearance relative to controls at all ages (Fig. 1n). Other parameters such as kidney-to-body-weight ratio, cyst quantity and cystic index did not vary with age (Fig. 1o–q). Remnant cysts expressed collecting duct markers (Fig. S2f) and increased slightly in size over time (Fig. S2g). Measurements of blood urea nitrogen (BUN, Fig. 1r) in double mutant kidneys were normal at P11 and P60 but exhibited a modest increase at P150. Overall, these experiments show that Aurka deletion prevents renal cystogenesis caused by loss of Inpp5e or Pkd1.
Aurka knock-out normalises ciliation, proliferation and DNA-damage responses
Alterations in ciliation, polarity and cell proliferation are associated with renal cyst formation14,15,38,39. Confocal analysis found no obvious changes in collecting duct adhesion and polarity from KSP immunostaining of Inpp5e∆/∆ kidneys at P21, Pkd1∆/∆ kidneys at P11 and their rescued counterparts (Fig. S2h). Furthermore, no significant changes were observed in cilia structure in renal epithelial cells in Inpp5e∆/∆ mice at P4 (Fig. 2a, S2i). Cystic cells also displayed enhanced proliferation (Fig. 2b. S2j), however, no change in cilia length at P21 was observed (Fig. 2c). Collecting duct cell ciliation in control mice decreased from ~100% to ~80% between P0 and P21 (Fig. 2d). Studies in murine Inpp5e−/− fibroblasts indicate that the protein regulates cilia disassembly in response to growth factor stimulation40, but the level ciliation at birth in Inpp5e∆/∆ collecting duct epithelia was indistinguishable from controls (Fig. 2d). However, ciliation decreased at the onset of cyst initiation at P4, paralleling the increase in cell proliferation (Fig. 2b, d). Co-deletion of Aurka largely normalised cell proliferation and ciliation (Fig. 2d) aside from a small reduction in comparative cilia number at P21 (Fig. 2d). It is likely that this reduction is due to loss of INPP5E and its broader role in maintaining cilia stability independently of AURKA’s actions41. Similar analysis of Pkd1∆/∆ kidneys found no changes in cilia structure (Fig. 2e), proliferation (Fig. 2f) or length (Fig. 2g) at birth, while the reduction in ciliation and increase in cell proliferation characteristic of cyst progression were both normalised by co-deletion of Aurka (Fig. 2h). DNA damage has been reported in ciliopathy models42 and increased γ-H2AX expression is a feature of Inpp5e and Pkd1 mutant kidneys43. However, co-deletion of Aurka normalised this marker in both JS (Fig. 2i, j, S2k) and ADPKD models (Fig. 2k, S2k, S2i). Examination of ciliation and expression of Ki67 and γH2AX in breakthrough cysts of both Inpp5e and Pkd1 mice confirmed cellular phenotypes similar to those arising from deletion of each gene alone, further supporting the idea that they derive from cells escaping Cre mediated deletion of Aurka (Fig. S2m–r). Overall, these results show that co-deletion of Aurka normalises cyst associated differences in cell ciliation, proliferation and DNA damage in both Inpp5e∆/∆ and Pkd1∆/∆ mice.
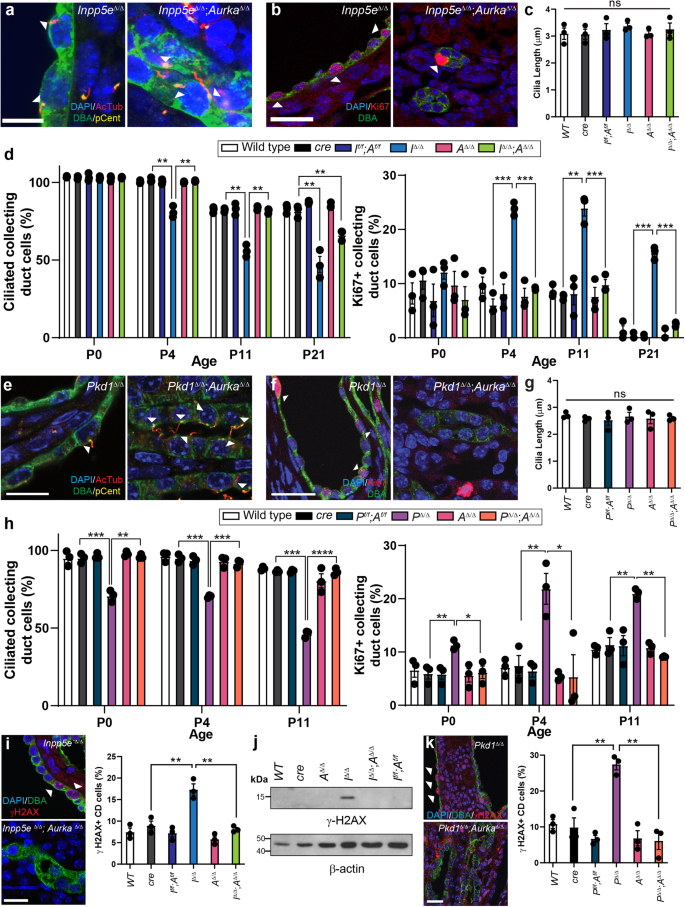
a, e P4 kidney sections immunostained for DAPI, acetylated-tubulin (AcTub), Pericentrin (Pcent) and DBA. Arrowheads indicate collecting duct cells with cilia. Bar = 12 μm (Inpp5e), 10 μm (Pkd1). b, f P4 kidney sections immunostained for DAPI, Ki67 and DBA. Arrowheads demonstrate collecting duct cells positive for Ki67. Bar = 25 μm. c, g Quantification of collecting duct cilia length at P21 in Inpp5e model and P11 in Pkd1 model, respectively (ns not significant). d, h-left Quantification of the proportion of collecting duct cells exhibiting cilia across the time points indicated. Inpp5e p values for pairs indicated from left to right; p = 0.0021, p = 0.0047, p = 0.0020, p = 0.0016, p = 0.0056 and p = 0.0039. Pkd1 p values for pairs indicated from left to right; p = 0.0006, p = 0.0017, p = 0.0008, p = 0.0008, p = 0.0002, p = 0.00001. d, h-right Quantification of the proportion of collecting duct cells stained for Ki67 across time. Inpp5e p values for pairs indicated from left to right; p = 0.0002, p = 0.0007, p = 0.0031, p = 0.0013, p = 0.0002 and p = 0.0005. Pkd1 p values for pairs indicated from left to right; p = 0.0092, p = 0.0171, p = 0.0096, p = 0.0180, p = 0.0045, p = 0.0010. i, k P4 Kidney sections immunostained for DAPI, γ-H2AX and DBA; arrowhead indicate CD cells expressing γ-H2AX reactivity. Quantification of P4 γ-H2AX expression in collecting ducts (Inpp5e p values for pairs indicated from left to right; p = 0.0043, p = 0.0069, Pkd1 p values; p = 0.0042, p = 0.0016). j Western blot for relative γ-H2AX expression at P21, re-probed with Actin, Bar = 25 μm. All graph data indicates mean ± S.E.M. n = 3 all subpanels. Additional data in Figs. S1 and S2. Full vertical lane scans of WB image (j) in Source Data File. Exact data point values provided in supplementary material- Source Data File.
Aurka deletion reduces the severity of adult-onset ADPKD
The rate of cyst formation differs between neonatal and conditional late onset models of ADPKD, a finding attributed to a shift in organ metabolism at postnatal day 1344. To examine whether Aurka deletion could also ameliorate cyst development after this shift in adult mice (more analogous to ADPKD in humans), we employed a doxycycline-inducible model of ADPKD17 which employs Pax8-rtTA and TetO-Cre transgenes to mediate gene knockout in the collecting duct, proximal and distal tubules of the nephron. ADPKD was induced at 4 weeks of age and kidneys were collected at 12, 18 and 20 weeks of age, at which point advanced cystic kidney disease had developed in mice lacking Pkd1 (Fig. 3a). Analysis of cyst size, number and cystic index identified significant improvements in all three measures induced by co-deletion of Pkd1 and Aurka (Fig. 3a–d). although improvements in kidney-to-body-weight ratios and Blood Urea Nitrogen (BUN) measurements, which vary considerably with disease progression at these earlier time points, were not apparent (Fig. S3a, b). In contrast to early onset PKD induced by Hoxb7-cre mediated Pkd1 deletion (see Fig. 1k–m), cyst development was also attenuated by deletion of a single copy of Aurka. It was noted this phenomenon was less evident in proximal tubules, which may relate to differences in AURKA expression between tubule types (Fig. S3c–e). While mice lacking Pkd1 rapidly succumbed to disease by the ethically allowed limit of the experiment (20 weeks of age), we found that both hetero- and homozygous deletion of Aurka significantly improved the survival in a dose dependent manner and this correlated with partial restoration of kidney function reflected in BUN ratios at experimental end points (defined as the conclusion of the 20-week time course or at the point of humane euthanasia if earlier) (Fig. 3e).
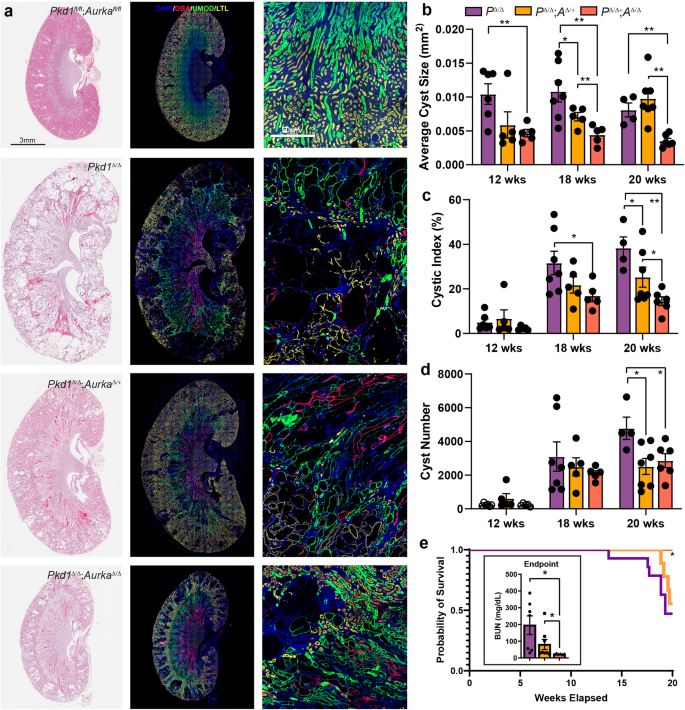
a Representative images of whole mouse kidney sections stained for either Haematoxylin and Eosin (H&E, left), or DAPI, DBA, Uromodulin (UMOD) and LTL (middle and right). Kidneys were collected at 20 weeks of age from mice of the indicated genotypes. Scale bar = 3 mm (left and middle), 50 μm (right). The staining intensity of DBA was low in Pkd1 f/f; Aurka f/f non-cystic animals compared to cystic animals. b The average cyst size per cross-section for overall cyst analysis, significant p values indicated from left to right: 0.0054; 0.0282, 0.0027, 0.0084, 0.0077, 0.0001. c Analysis of cystic index measured overall; p values indicated from left to right: 0.0170, 0.0445, 0.0055, 0.0295. d Quantitation of the average cyst number per cross-section overall; p values indicated from left to right: 0.0158, 0.0272. e Kaplan–Meier curve indicating survival of Pkd1Δ/Δ, Pkd1Δ/Δ;AurkaΔ/+ and Pkd1Δ/Δ;AurkaΔ/Δ over time. Comparing all three genotypes gives p = 0.0491 (Mantel-Cox test, Chi-square 6.029, df 2). Pairwise comparison p value between Pkd1Δ/Δ and Pkd1Δ/Δ;AurkaΔ/Δ = 0.0166. Assessment of Blood Urea Nitrogen (BUN) as a measure of kidney function mice of indicated genotypes at experimental end point (either that the conclusion of 20-week time course or at the point of humane euthanasia if earlier, left to right p = 0.0108 and p = 0.0493). All graphs indicate mean ± S.E.M. (a–d) n = 4–8 at all time points for all genotypes, see exact n and data point values provided in supplementary material- Source Data File. Kaplan–Meier curve data displays n = 20 (Pkd1Δ/Δ), n = 19 (Pkd1Δ/Δ;AurkaΔ/+) and n = 16 (Pkd1Δ/Δ;AurkaΔ/Δ). Cysts were not present in the kidneys mouse genotypes not indicated. Additional data in Figs. S3 & S4.
While our initial experiments showed a critical pathogenic role of Aurka when temporally co-deleted with either Inpp5e or Pkd1, we sought to examine the impact of Aurka deletion in established cysts. To do so we utilised the Pkd1 RC model which includes a hypomorphic Pkd1 variant first identified in an ADPKD patient45. Initial assessment of disease (via kidney-to-body-weight ratios) in this model indicated existing disease at postnatal day 28, a slow progression of disease up to 6 months of age without significant sex difference, with sex divergence from 6 to 9 months of age (Fig. S4a). After allowing significant cyst development in this model, we then deleted AURKA at 4 weeks (P28) of age using the Dox system previously employed to study late onset disease, ageing mice to 26 weeks (6 months) of age. This maximum time point therefore facilitates pooling of sexes as it proceeds the sex divergence. Assessment of cystic phenotypes at this point demonstrated that Aurka deletion had completely halted cyst growth (Fig. S4b–f). There was no overt decrease in cyst number in this experiment, as it is likely the early events precipitating cystogenesis have already occurred at the point at which Aurka was deleted. Furthermore, the modest gain in cyst quality over time more likely reflects cysts that were present at P28 but below the detection threshold.
AURKA alters the AKT signalling pathway
To profile the molecular drivers of cyst development curtailed by Aurka deletion, we performed RNA sequencing of ADPKD and JS cystic kidneys at P4 (to preclude changes associated with advanced disease) with and without concomitant Aurka deletion. 485 significant gene expression changes were found in Inpp5eΔ/Δ kidneys relative to cre controls but only 40 were apparent upon co-deletion of Aurka (Fig. 4a). This magnitude of this normalisation suggests that INPP5E and AURKA act closely at a functional level. Although the expression of 120 genes was changed in Aurka∆/∆ kidneys relative to cre only controls, these did not enrich any KEGG signalling pathways or obvious PKD-related genes. Analysis of Pkd1Δ/Δ samples identified 1532 dysregulated genes relative to cre controls (Fig. 4b) but unlike our JS model, this number was only modestly corrected by Aurka co-deletion (to 1252 genes)(Fig. 4b), despite the rescue in cystic disease phenotypes. A full list of differentially expressed genes is included in Supplementary Data 1. To determine whether common Aurka-dependent drivers of cystogenesis were apparent in our JS and ADPKD models, we compared changes in KEGG pathways in single mutants (Inpp5e or Pkd1, versus cre controls) and double mutants (Inpp5e; Aurka or Pkd1; Aurka versus single mutants) (Fig. 4c, Supplementary Data 2). We identified five shared dysregulated pathways: Pathways in cancer, MAPK, Breast cancer, Gastric cancer and, notably, the AKT signalling pathway. These results suggest that while the individual genes modulated by AURKA differ in both PKD models, they feed into a small subset of common signalling pathways.
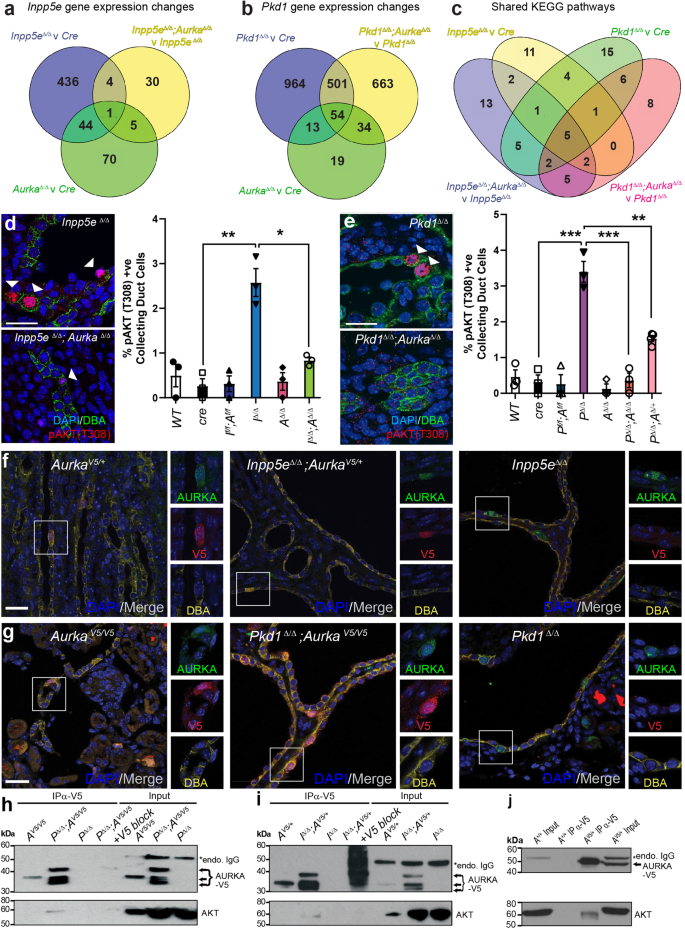
Venn diagrams show the number of genes whose expression varies by ±1.5-fold in P4 Inpp5e (a) and Pkd1 (b) mouse models comparing the genotypes indicated. c Venn diagram comparing altered KEGG Pathways in P4 kidneys of indicated genotypes. d, e Staining of P4 kidney sections for DAPI, pAKT (T308) and DBA (arrowheads indicate pAKT T308 expression; bar = 25 μm) and their quantifications. Inpp5e p values from left to right; p = 0.0035, p = 0.0130 and Pkd1 p values; p = 0.0008, p = 0.0008, p = 0.0085. f, g Expression and co-localisation of AURKA-V5 and AURKA in control and cystic kidneys of both models at P15 and P11 respectively (bar = 25 μm). h Co-immunoprecipitation of endogenous AKT with AURKA-V5 from P11 Pkd1Δ/Δ mouse kidneys and competition with V5-peptide (blocking IP) (* = mouse endogenous IgG). i Co-immunoprecipitaton of endogenous AKT as in (h) from Inpp5eΔ/Δ kidneys at P15. Additional data in Fig. S5. j Co-immunoprecipitation of endogenous AKT from testis extracts. All graphs display mean ± S.E.M. a–c n = 6, d, e n = 3–4, f–j n = 3. Exact n and data point values provided in supplementary material- Source Data File.
INPP5E regulates AKT activation via degradation of the phosphoinositide PI(3,4,5)P3 which localises AKT to the inner wall of the plasma membrane, allowing its activation by phosphorylation at T308 by PDK146 and S473 by mTOR47,48. We have previously reported increases in phosphorylation at both residues in cystic epithelium in advanced disease caused by loss of Inpp5e14 and so sought to determine whether similar changes were evident early in cyst progression. We found that at P4 the number of pAKT (T308)+ collecting duct cells exhibiting was significantly elevated in both Inpp5eΔ/Δ and Pkd1Δ/Δ mice but reduced upon co-deletion of Aurka (Fig. 4d, e). Pkd1Δ/Δ;Aurka∆/+ mice exhibited an intermediate reduction in the number of pAKT T308 collecting duct cells (Fig. 4e). Furthermore, partitioning this data by cystic and non-cystic tubules demonstrated the elevation of pAKT (T308) was localised within cystic tubules (Fig. S5a, b). At this early timepoint no changes in pAKT (S473) were noted, although baseline phosphorylation levels were higher than for pAKT (T308) (Fig. S5c). Upregulation of AKT expression, an increase in the AKT pT308/total AKT ratio and downstream pathway activity (via p4EBP1 T37/46) was further confirmed by AlphaLISA assays in the JS murine model and these parameters were normalised upon Aurka deletion (Fig. S5d–f). In our ADPKD model, an increase in the AKT pT308/total AKT ratio and downward trend upon Aurka deletion was seen by phospho-immunoblotting (Fig. S5g–i). These findings indicate that heightened AKT activity mediated by AURKA is commonly associated with early cyst development driven by Inpp5e or Pkd1 deletion in collecting duct cells.
Given that Aurka deletion apparently modulates AKT activity and correlates with ameliorated cyst development, we examined whether the two proteins might form a physical complex. As commercial antibodies raised to human AURKA did not exhibit sufficient affinity to immunoprecipitate its mouse orthologue, we engineered a c-terminal V5-tag into the endogenous mouse Aurka allele using CRISPR technology. The resulting AurkaV5/V5 mice were viable and healthy, confirming the V5-tag did not impair AURKA function. AurkaV5 mice were inter-crossed with our neonatal PKD models to generate mice expressing AURKA-V5 from at least one AURKA allele. Immunostaining of kidneys showed co-localisation of V5 and AURKA; particularly in cystic Pkd1Δ/Δ;AurkaV5/V5 and Inpp5eΔ/Δ;AurkaV5/+ mice but not in unmodified disease controls (Fig. 4f, g). The Aurka-V5 allele did not alter the development of PKD in either model (Fig. S5j, k). V5 pulldown experiments enriched multiple AURKA-V5 bands consistent with known N-terminally processed isoforms49(Fig. 4h, i) and full-length isoforms were further detected in control testis extracts50(Fig. S5l, m). Specific interactions between AURKA-V5 and AKT were observed in cystic Pkd1Δ/Δ; AurkaV5/V5 and Inpp5eΔ/Δ;AurkaV5/+ samples but not in control AurkaV5/V5, AurkaV5/+, Pkd1Δ/Δ or Inpp5eΔ/Δ mice (Fig. 4h, i). Addition of competing/blocking V5-peptide countered AURKA-V5 enrichment and blocked AKT co-immunoprecipitation confirming the interaction was mediated by AURKA and not the V5-tag (Fig. 4h, i). To investigate whether AKT interacted solely with N-terminally truncated isoforms of AURKA or could also interact with full-length AURKA, we repeated the AURKA-V5 pulldown experiments with testis extracts which express only full-length AURKA. Once more, AKT was observed to co-purify with AURKA-V5 (Fig. 4j), indicating that AKT interacts with multiple isoforms of AURKA.
AURKA regulates pAKT (T308) status and co-localises with PDK1
To further investigate how AURKA might contribute to AKT pathway regulation, sub-confluent mouse collecting duct (mIMCD3) cells were transfected with siRNA to reduce AURKA levels (Fig. 5a, b). This led to relative decreases in pAKT (T308) (but not pAKT (S473)) (Fig. 5c, d) and to modest reductions in total AKT (Fig. 5e). Treatment with the AURKA kinase inhibitor Alisertib resulted in reduced pAURKA (T288)/total AURKA ratio following 48 h of exposure (Fig. S6a) but unexpectedly led to in a 1.5-fold increase in AURKA protein levels (Fig. 5f, g). Elevated AURKA was associated with an increase in pAKT (T308) (Fig. 5h, i) and a modest reduction in total AKT (Fig. 5j). This phenomenon was not observed following 24 h of Alisertib exposure (Fig. S6b), suggesting that activation of pAKT (T308) occurs after longer Alisertib exposure periods, possibly because of AURKA accumulation. To confirm whether over-expression of AURKA could stimulate AKT activity in a kinase-independent fashion, HA-tagged wild type and kinase dead (KD; K162R) AURKA were expressed (Fig. 5k, l). Neither construct demonstrated auto-phosphorylation of T288 (Fig. S6c), however both constructs increased pAKT (T308) (but not S473, Fig. 5m, n) levels with KD increasing total AKT (Fig. 5o). This indicates the activation of AKT involves kinase-independent actions of AURKA. These effects were not observed upon serum starvation (Fig. S6d).
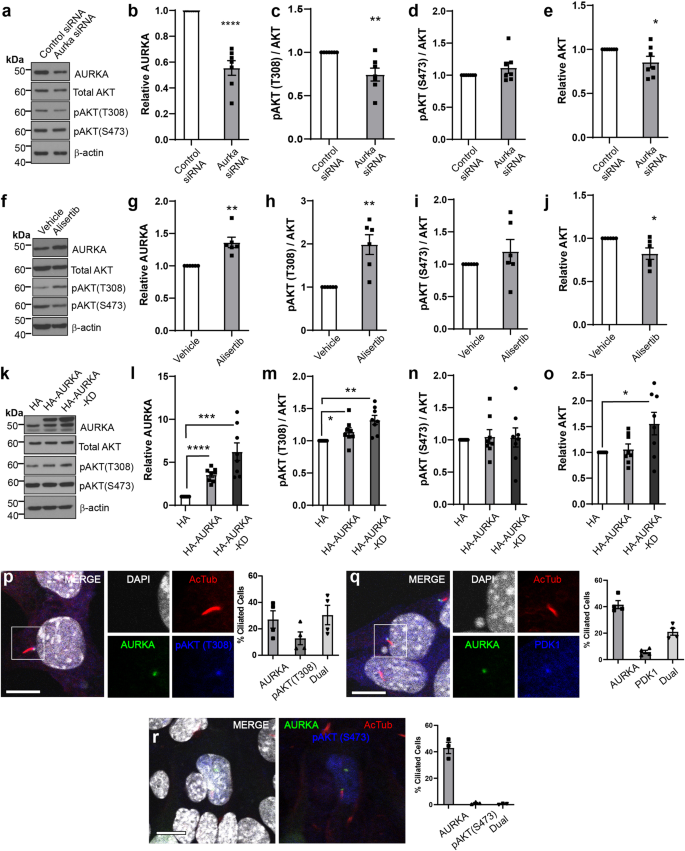
a–e Western blots and densitometry of mIMCD3 cell lysates transfected with control siRNA or Aurka siRNA#1 (cultured for 24 h). P values from left to right; p = 0.0001, p = 0.0069, p = 0.0360. f–j Western blots and densitometry of mIMCD3 cell lysates treated with Alisertib for 48 h under growth conditions and probed as indicated. P values from left to right; p = 0.0033, p = 0.0039, p = 0.0223. k–o Western blots and densitometry of mIMCD3 cell lysates transfected with HA, HA-AURKA or HA-AURKA KD expression plasmids (cultured 24 h) and probed as indicated. Densitometry values are sum of multiple bands observed. P values from left to right for pairs indicated; p = 1.8 × 10⁻⁵, p = 0.0007, p = 0.0313, p = 0.0014, p = 0.019. p Immunostaining for DAPI, AURKA, and pAKT (T308) in mIMCD3 cells showing co-localisation at the basal body and the distribution of protein localisation. q Immunostaining for DAPI, AURKA, and PDK1 in mIMCD3 cells showing co-localisation at the basal body and the distribution of protein localisation (bar = 10 μm). r Immunostaining for DAPI, AURKA, and pAKT (S473) in mIMCD3 cells showing no co-localisation at the basal body (bar = 10 μm). All graph data indicate mean ± S.E.M. Control references defined as 1. pT308 pAKT (T308). a–e n = 7, f–j n = 6, k–o n = 8, p–q n = 4, r n = 3. Additional data in Figs. S6 and S7. Western blots represent biological replicates with each independent experiment set run on a separate gel or two replicates on a gel. Each control sample within a replicate set was then defined as 1. The western membranes were cut to 40−60 kDa interval before antibody probing, repeated stripping and reprobing of the same membrane to generate datasets. Individual western blot scans, n and data point values provided in supplementary material- Source Data File. All graph data indicate mean ± S.E.M.
We next employed immunofluorescence to determine where this interaction may take place and found that AURKA and pAKT (T308) co-localised to the cilia base (Fig. 5p), along with PDK1, the principal mediator of AKT(T308) phosphorylation (Fig. 5q). While AURKA was often found alone at this subcellular location, the same was not true for either pAKT or PDK1 which largely co-localised with AURKA at this location (Fig. 5p, q). This dynamic suggests AURKA scaffolds recruitment of a complex of these factors. In contrast, pAKT S473 was largely absent from the basal body (Fig. 5r) and rarely co-localised with AURKA.
Given, the observation that Alisertib acts as an agonist of AURKA’s kinase-independent functions, we next tested if other AURKA kinase inhibitors triggered elevated AURKA levels and concomitant increases in AKT pT308. Analogous experiments using MK5108, VX680 and C1368 found that both phenotypes were apparent after 48 h of exposure (Fig. S7a–c).
Alisertib increases cystogenesis in vivo in JS model
Previous studies had suggested that treatment of an adult-onset ADPKD model with Alisertib resulted in exacerbation of cystic phenotypes32,33, an observation consistent with the increase in AURKA stability and AKT activation noted in vitro (Fig. 5f–i). To examine whether similar effects were evident in our model of Joubert Syndrome and reflective of a shared cyst promoting mechanism, we treated Inpp5eΔ/Δ mice and control animals with the drug from P9 to P13, collecting tissue at P15 (a period during which cyst number is actively increasing). Alisertib activity was reflected in the hair loss observed in all treated mouse cohorts (but not vehicle, Fig. 6a), a side effect also observed in human trials51. While initial analysis of Alisertib-treated Inpp5eΔ/Δ mice identified a modest reduction in kidney-to-body-weight ratio and cyst size suggestive of therapeutic benefit (Fig. 6a–c), cystic index was unchanged (Fig. 6d) and cyst number was significantly increased (Fig. 6e). In contrast, Inpp5eΔ/Δ;AurkaΔ/Δ Alisertib-treated mice displayed no change in kidney-to-body-weight ratio, cyst index, cyst number or cyst size (Fig. 6b–e), confirming Alisertib requires AURKA (and not AURKB or other targets) to elicit these pro-cystogenic effects. In vehicle-treated Inpp5eΔ/Δ kidneys, we observed focal AURKA and AKT co-localisation in cilia and resorbing cilia structures at low frequency, as expected for asynchronous cycling cells (Fig. 6f). However, Alisertib treatment of the same mice markedly reduced ciliated cells (Fig. 6g) but not in Inpp5eΔ/Δ;AurkaΔ/Δ animals (Fig. 6g). Alisertib’s biological actions were further confirmed by examining p53, which is specifically inhibited by AURKA’s kinase activity27 and whose nuclear localisation and active form were increased as expected (Fig. 6h, i).
a Mice, whole kidneys and sections following treatment with vehicle or Alisertib (bar = 1 cm for kidneys; 2 mm for sections). b–e Quantification of combined kidney weight over total body weight, cyst number, cyst size and cystic index for vehicle and Alisertib-treated mice. P values are 0.0003 and 0.0059 (b), 0.0247 (c) and 0.0117 (e). f Ciliary co-localisation of AURKA and pAKT (T308) in Inpp5eΔ/Δ kidneys (bar = 10 μm). g Quantification of ciliated collecting duct cells following treatment with vehicle and Alisertib. P values from left to right; p = 0.0012, p = 0.0162. h, i Active-p53 in collecting ducts of Inpp5eΔ/Δ kidneys (arrow = nuclear p53; bar = 25 μm). P values from left to right; p = 0.0123, p = 0.0022. j, k Staining and quantification of AURKA and pAKT (T308) +ve collecting duct cells. P values from left to right; p = 0.0173, p = 0.0035. l Quantification of the proportion of dual AURKA/Ki67+ve collecting duct cells. P values from left to right; p = 0.0072, p = 0.0009. All graph data indicate mean ± S.E.M. pT308 pAKT (T308). ns not significant. White bars = vehicle; Grey bars = Alisertib treatment. a–b n = 3–5, c–l n = 3. All data from P15. Additional data in Fig. S8. Exact n and data point values provided in supplementary material- Source Data File.
Consistent with our in vitro findings, Alisertib treatment of Inpp5eΔ/Δ mice increased AURKA (Fig. S8a) and pAKT (T308) positive epithelial cells (Fig. S8b). Double AURKA and pAKT (T308) positive epithelial cells (Fig. 6j, k) were similar in quanta to the % of pAKT (T308) positive collecting duct cells. AURKA also co-labelled with Ki67 (Fig. 6l and Fig. S8c). These observations confirm that Alisertib-driven stabilisation of AURKA and pAKT (T308) phosphorylation occur together in cyst cells and that these marks correlate with the features of increased cyst burden, increased cilia resorption and hyper-proliferation. Taken together with our findings in mIMCD3 cells, these experiments provide evidence that while Alisertib inhibits AURKA’s kinase activity, it is a specific agonist of AURKA’s kinase-independent cystogenic function(s).
Inhibition of AKT constrains cyst formation
Our observations suggest that activation of AKT is an important step in driving renal cystogenesis. To test this, we performed an oral dosing experiment with MK2206, an allosteric AKT inhibitor which impairs phosphorylation of AKT at both T308 and S47352. We treated Inpp5eΔ/Δ pups daily from P9 and harvested on P15 (similar to the time course of previous Alisertib treatment) and found that the kidneys of Inpp5eΔ/Δ mice treated with 75 mg/kg of MK2206 were significantly smaller than vehicle controls (Fig. 7a, b and Fig. S9a). Moreover, AKT inhibition reduced the cystic index (Fig. 7c), number of cysts (Fig. 7d) and cyst size (Fig. 7e). Treated animals also exhibited increased ciliation (Fig. 7f), a reduction in the proportion of collecting duct cells expressing pAKT (T308) (Fig. 7g, h, S9b) and reduced pAKT (S473)(Fig. S8c), confirming the drugs bioactivity. Notably, the proportion of AURKA+ cells was also reduced by MK2206 (Fig. S9d), an observation consistent with AKT’s previously reported transcriptional regulation of Aurka15. The number of cells co-expressing AURKA and Ki67 was also reduced (Fig. S9e, f).
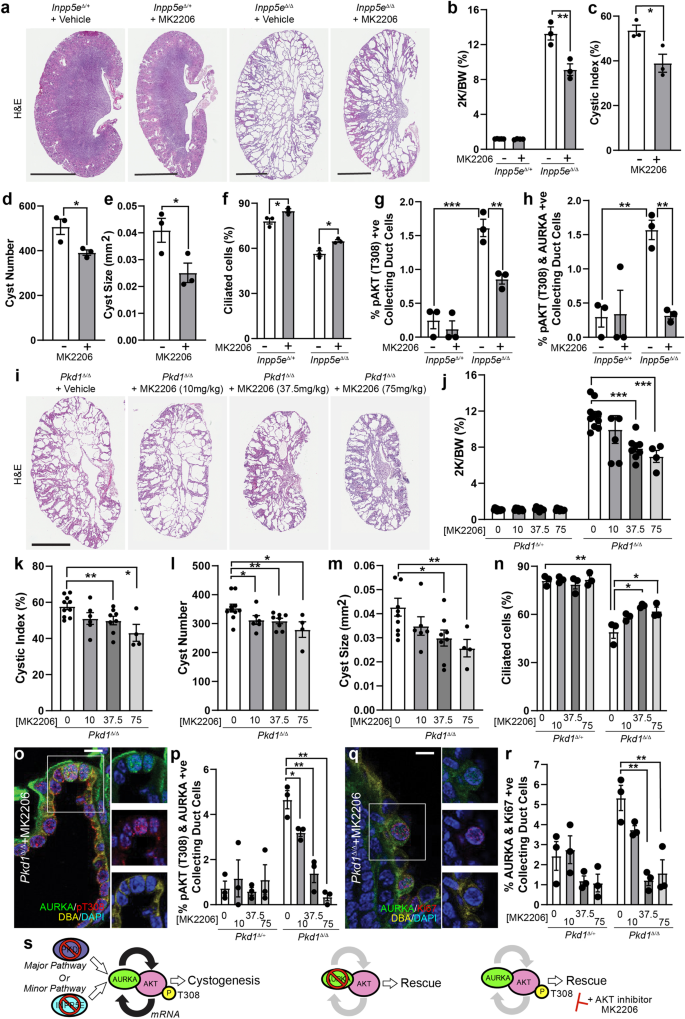
a, i Whole kidneys from mice treated with vehicle or MK2206 (bar = 1 cm (Inpp5e); 0.5 cm (Pkd1)). b, j Quantification of the combined kidney weight over total body weight percentage (2 K/BW%). P values as indicated are p = 0.0075 (b), p = 1.8 × 10⁻⁵ for 37.5 mg/kg; p = 0.0006 for 75 mg/kg (j). c, k Cystic index quantification, p = 0.0233 (c), p = 0.0096 for 37.5 mg/kg; p = 0.0226 for 75 mg/kg (k). d, l Quantification of average cyst number per section, p = 0.0323 (d), p = 0.0314 for 10 mg/kg; p = 0.0080 for 37.5 mg/kg; p = 0.0306 for 75 mg/kg (n). e, m Average cyst cross-sectional size, p = 0.0267 (e), p = 0.0102 for 37.5 mg/kg; p = 0.0046 for 75 mg/kg (m). f, n Ciliation, p = 0.0249 and 0.0118 for (f) and p = 0.0035, p = 0.0269, p = 0.0327 for (n). o Staining for AURKA, DBA and pAKT (T308) in mice exposed to MK2206 or vehicle controls (bar = 10 μm). g Quantification of pAKT (T308) +ve co-labelled collecting duct cells. P values from left to right; p = 0.0008, p = 0.0062. h, p Quantification of pAKT (T308)/AURKA +ve co-labelled collecting duct cells. P values from left to right; p = 0.0018, p = 0.0034 for (h) and p = 0.0263, 0.0024 and 0.0017 for (p). q, r Staining and quantification of Ki67/AURKA collecting duct cells. P values from left to right; p = 0.0061 and 0.0075, bar = 10 μm. All graph data indicate mean ± S.E.M. pT308 pAKT (T308). White bars = vehicle; Grey bars = MK2206 treatment. a–h n = 3–5, i–j n = 4–12, k–m 4–10, n–r n = 3. Inpp5e model used MK2206 at 75 mg/kg and data is at P15. Pkd1 model used MK2206 doses as indicated and data is at P11. Additional data in Fig. S8. s A model of the role of AURKA and AKT in regulating cystogenesis in PKD. Deletion of either Pkd1 (Major pathway driver) or Inpp5e (Minor pathway driver) result in upregulation of AURKA and enhanced AKT activity through phosphorylation of T308 to form a self-reinforcing signalling loop driving cystogenesis. Co-deletion of Aurka prevents AKT activation and stops cyst formation. Inhibiting AKT activity with MK2206 breaks the feedback loop and also reduces cyst formation. Exact n and data point values provided in Source Data File.
We repeated this experiment using our early onset ADPKD model, in which disease progression is more rapid. Animals were treated daily with 10, 37.5 or 75 mg/kg of MK2206 from P4 to P10 before sacrifice at P11. These dosages were generally well tolerated, although Pkd1∆/∆ mice (but not control animals) treated with 75 mg/kg were runted by the end of the treatment regime. Treated animals displayed a considerable improvement in renal morphology, with more normal renal parenchyma apparent compared to vehicle-treated controls (Fig. 7i). These changes were associated with significant, dosage-dependent, reductions in kidney-to-body-weight ratio (Fig. 7j), cystic index (Fig. 7k), cyst number (Fig. 7l) and cyst size (Fig. 7m). Pkd1∆/+ mice treated with MK2206 did not show any significant changes in renal morphology (Fig. S9g, h). The reduction in disease severity in treated ADPKD animals was associated with corrections in the levels of cell ciliation (Fig. 7n) and a reduction in the number of collecting duct cells co-expressing AURKA, pAKT (T308) (Fig. 7o, p) and Ki67 (Fig. 7q, r). These results confirm the actions of MK2206 on AKT phosphorylation and identify a role for AKT in cyst formation in mouse models of JS and ADPKD.
- The Renal Warrior Project. Join Now
- Source: https://www.nature.com/articles/s41467-023-44410-9