Mice
Pod:cre-GCaMP3 (C57Bl6/N) mice of both sexes at the age of 4 weeks were used. Control mice (n = 3) received no treatment; for NTS nephritis induction animals received a single i.p. injection of NTS (Probetex, PTX-001-S, San Antonio, TX, USA): low dose 8 µl/g (n = 4) or high dose 11 µl/g (n = 3). No method of randomization or blinding was used. Mice were bred and kept in individually ventilated cages under specific-pathogen free conditions in an in vivo research facility (CECAD, Cologne). Mice were monitored for weight loss and proteinuria starting on day 3 (not shown). After 5 days mice were euthanized by cervical dislocation and the kidneys were harvested. All experiments were approved by the LANUV NRW, Germany, with the authorization number: VSG 81-02.04.2018.A351. Animal experiments complied with LANUV regulations and the ARRIVE guidelines28.
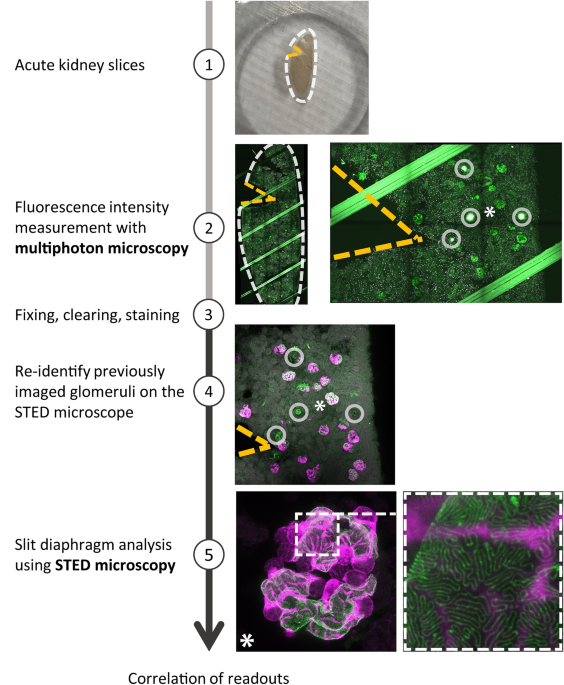
Preparation of acute kidney slices (AKS) and MP microscopy
Freshly harvested mouse kidneys were embedded in low-melting agarose (4%) and cut into 300 µm slices using a vibratome (Leica, VT1200 S). Slices were maintained in Krebs-Henseleit-Buffer carbogenated with 95% O2/5% CO2 before and during the experiment29. To enable identical slice orientation in both imaging modalities, a triangle-shaped piece of tissue was cut from the AKS at the upper left corner. To ensure tissue integrity and exclude glomerular damage caused by cutting, AKS were incubated with propidium iodide (5 µM, Sigma) for 5 min. Glomeruli, which contained cells with nuclear propidium iodide staining, were excluded from the analysis. MP imaging was performed with a TCS SP8 MP-OPO microscope (Leica Microsystems) with a Chameleon Vision II laser (Coherent) tuned to 940 nm within a maximum of 5 h after harvesting the kidneys. Burning marks for reorientation were created by laser ablation using the ‘bleach point’ tool of the Leica Software. Single field of view z-stacks of glomeruli were acquired with 512 × 512 pixel and around 50–60 µm total stack size. After MP imaging, all AKS were fixed with 4% formaldehyde overnight.
Preparation of acute kidney slices for STED microscopy
Immunofluorescent labeling was conducted as previously described14. Shortly, all fixed AKS were optically cleared, followed by consecutive primary and secondary antibody incubation in PBS-T (0.1% Trition-X100 in PBS) for 24 h at 37 °C. If only STED microscopy was performed a piece of the kidney was immersed in hydrogel, the gel was polymerized for 3 h at 37 °C and ultimately washed with PBS. The piece was then cut into 200 µm slices using a vibratome (Leica, VT1200 S). The slices were then processed in an identical way as AKS.
Primary antibodies used: guinea pig anti-nephrin (Fitzgerald, 20R-NP002, 1:100), anti-GFP-Alexa647 (Thermo Fisher, A-31852, 1:100) for labelling GCaMP3. Secondary antibody: donkey anti-guinea pig Atto594 (coupled in house, 1:100). Confocal and STED images of fixed samples were acquired with a TCS SP8 gSTED 3X microscope (Leica Microsystems) equipped with a white light laser and a 775 nm 2D donut STED depletion laser (Leica Microsystems). The excitation wavelengths were: λEx = 594 nm for Atto594 and λEx = 650 nm for Alex647, channels were acquired sequentially. We obtained images with a resolution of 0.011 µm per pixel, with a 2048 × 2028 pixel image size. For each glomerulus, only one nephrin-stained capillary surface was acquired as close to the coverslip as possible with a z-stack size of approximately 2–4 µm depending on the orientation of the capillary.
SD length analysis
SD length was measured using a previously published macro15. The analysis was conducted as described in detail in the original publication. The macro itself is deposited on GitHub: https://gist.github.com/github-martin/e699d18ae6cfa5b1a6aace15d3c3544c. In a few cases, where the image contrast was insufficient to use the macro, the SD length was measured manually using FIJI.
Calcium measurements
Calcium levels in podocytes were measured using FIJI and analyzed as previously published11. Briefly, maximum intensity projections of z-stacks of glomeruli were manually annotated with an ROI compromising the glomerular area. The mean fluorescence intensity of this ROI was used as a readout.
Statistics
For statistical analysis of mean fluorescence intensities and SD length per area, we used ordinary one-way ANOVA with Tukey’s multiple comparisons test. No data points were excluded. P values < 0.05 were considered statistically significant.
- The Renal Warrior Project. Join Now
- Source: https://www.nature.com/articles/s41598-024-63507-9