Study population
The NHANES is a nationally representative, cross-sectional survey conducted by the National Center for Health Statistics (NCHS) of the Centers for Disease Control and Prevention (CDC). This ongoing program with a 2-year reporting cycle targets the non-institutionalized civilian population of the United States and employs a complex multistage probability sampling design. Data collection in NHANES is carried out through a two-step process, starting with in-home interviews followed by physical examinations and laboratory tests at a Mobile Examination Center (MEC). Ethical approval for the survey was granted by the NCHS Research Ethics Review Board, and all participants provided written informed consent. Publicly accessible details on the NHANES’ data collection methods and methodology are available on the official website (cdc.gov/nchs/nhanes.htm).
For this study, data from the six cycles (2007–2008, 2009–2010, 2011–2012, 2013–2014, 2015–2016, and 2017–2018) were combined, resulting in an initial sample size of 59,842 individuals. Subsequently, the analysis was focused on 34,770 adults aged 20 years or older. Among them, 20,927 participants with incomplete data on OBS components were removed. We further excluding 128 participants missing key measurements that estimated glomerular filtration rate (eGFR) or albumin-to-creatinine ratio (ACR). Additionally, we eliminated data with incomplete covariates (i.e., age, sex, race/ethnicity, education, marital status, diabetes, hypertension, high-density lipoprotein (HDL), total cholesterol (TC), serum potassium, and serum sodium) (n = 342). Ultimately, the final sample for this study comprised 13,373 individuals. A detailed flowchart illustrating the participant selection process is presented in Fig. 3.
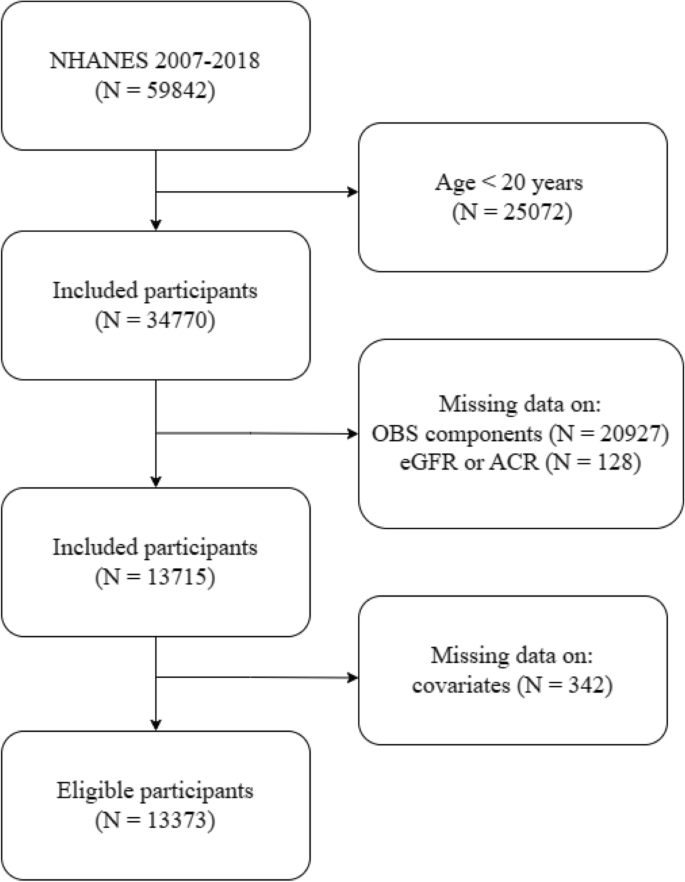
Flow chart of participant selection based on NHANES database from 2007 to 2018.
Oxidative balance scores
OBS were calculated by incorporating both dietary and lifestyle factors, using the method described in the related literatures29,30. This comprehensive approach involved selecting twenty components associated with oxidative stress—16 dietary and 4 lifestyle elements (Supplementary Table S1). These components were grouped as follows: (1) dietary antioxidants including fiber, β-carotene, riboflavin, niacin, vitamin B6, total folate, vitamin B12, vitamin C, vitamin E, and minerals like calcium, magnesium, zinc, copper, and selenium, (2) dietary pro-oxidants comprising total fat and iron, (3) lifestyle antioxidants represented by physical activity, and (4) lifestyle pro-oxidants such as alcohol consumption, smoking habits, and body mass index (BMI). The dietary component of OBS was derived from 24-h dietary recall interviews conducted in the NHANES Mobile Examination Center, without accounting for nutrients from dietary supplements or medications. Dietary components were categorized into tertiles, with dietary antioxidants scoring 0–2 points ascendingly and dietary pro-oxidants scoring reversely from 2–0 points. For lifestyle components, physical activity was classified as low (< 150 min/week), moderate (150–300 min/week), or high (> 300 min/week), with corresponding scores of 0, 1, and 2 points, based on the 2018 Physical Activity Guidelines for Americans31. Alcohol consumption was scored 0–2 points based on sex-specific consumption patterns, while smoking was evaluated using serum cotinine levels and assigned 0–2 points inversely across tertiles. BMI was calculated as weight in kilograms divided by the square of height in meters and categorized into normal (< 25 kg/m2), overweight (25–29.9 kg/m2), or obese (≥ 30 kg/m2), with scores of 2, 1, and 0 points, respectively. Overall, the OBS ranged from 0 to 40 points, with the total score being the sum of points from all sixteen dietary and four lifestyle components.
Chronic kidney disease
In this study, we defined the dependent variable as the presence of chronic kidney disease (CKD). CKD was primarily identified by two criteria: a urinary albumin-to-creatinine ratio (ACR) exceeding 30 mg/g or an estimated glomerular filtration rate (eGFR) falling below 60 mL/min/1.73 m232. 2021 CKD Epidemiology Collaboration equation is used to calculate eGFR based on serum creatinine levels33. The measurement of serum creatinine is employed the enzymatic method. Urine albumin levels were determined using a solid-phase fluorescence immunoassay, and urine creatinine was quantified through the modified Jaffé kinetic method. Additionally, we conducted a risk stratification of CKD patients based on the staging of CKD and the grading of albuminuria. These categories were as follows: mild risk, encompassing individuals with normal to mildly increased albuminuria (ACR < 30 mg/g); moderate risk, including those with moderately increased albuminuria (ACR: 30–300 mg/g); and high risk, comprising individuals with severely increased albuminuria (ACR > 300 mg/g)34.
Covariates
We further incorporated various factors potentially linked to OBS and the prevalence of CKD, drawing on existing clinical knowledge and research. These factors included sociodemographic variables, medical conditions, and biomedical data. All of sociodemographic variables were gathered from the NHANES questionnaire. Race was classified into Mexican American, Other Hispanic, Non-Hispanic White, Non-Hispanic Black, and Other Race. Educational attainment was divided into three levels: less than high school, high school graduate (including those with a high school diploma or an equivalency diploma like the General Educational Development), and more than high school education. Marital status was categorized as married, not married, and other (including separated, widowed, or divorced). Biomedical data and medical conditions taken into consideration included HDL (mg/dL), TC (mg/dL), diabetes (yes or no), hypertension (yes or no), serum potassium (mmol/L), and serum sodium (mmol/L). Body mass index (BMI) was calculated by dividing weight in kilograms by the square of height in meters. The presence of hypertension and diabetes was determined based on self-reported diagnoses. Both HDL and TC levels were measured using an enzymatic method with the Roche Modular P chemistry analyzer at the University of Minnesota. Detailed information about these measurement procedures is available in the NHANES Procedure Manuals.
Statistical analysis
Our study used sample weights in all analyses to ensure representativeness, taking into account the complex multi-stage probabilistic sampling design of NHANES. Categorical variables were presented as unweighted counts and weighted percentages, whereas continuous variables were expressed as weighted means with standard errors. Weighted analysis of variance (ANOVA) and weighted chi-square tests for continuous and categorical variables, respectively. The OBS was categorized into quartiles (Q1, Q2, Q3, Q4), with Q1 serving as the reference group. Logistic regression models were utilized to explore the association between OBS and CKD prevalence. These models varied in terms of adjustment for confounding factors: Model 1 was unadjusted, Model 2 adjusted for sociodemographic variables (age, sex, ethnicity, marital status, and education level), and Model 3 further adjusted for potential correlates including age, sex, ethnicity, marital status, education level, high-density lipoprotein (HDL), total cholesterol (TC), diabetes, hypertension, serum potassium, and serum sodium. Our analysis also extended to the examination of OBS’s association with eGFR and albuminuria, applying identical modeling approaches. Additionally, CKD patients were classified into mild, moderate, and high-risk categories. Logistic regression models were again utilized to evaluate the relationship between OBS and different CKD risk stratifications, using the lowest quartile of OBS (Q1) as the reference group. We explored dose–response dynamics between OBS and CKD prevalence using restricted cubic spline curves, with model adjustments mirroring those in Model 3.
Subgroup analyses were stratified according to age, sex, race, marital status, education, hypertension, and diabetes to assess the consistency of the OBS–CKD association across different demographic and clinical profiles. We assessed interactions among covariates using likelihood ratio tests, adjusting models for relevant covariates excluding the stratification variables.
All statistical analyses were conducted using R software, version 4.2.1 (https://www.r-project.org/). For all tests, a two-sided P-value of less than 0.05 was considered to indicate statistical significance.
- The Renal Warrior Project. Join Now
- Source: https://www.nature.com/articles/s41598-024-64147-9