Kir4.2 deletion causes K+ wasting following dietary K+ depletion
A previous report of independently generated Kir4.2−/− animals displayed minimal electrolyte abnormalities at baseline10. To determine if this was the case in our Kir4.2−/− mice, we measured baseline blood and urine electrolytes in control (Kir4.2+/+) and Kir4.2 knockouts. Consistent with this previous report, our knockout animals did not display differences in blood or urine electrolytes except for slightly higher blood Cl– levels compared to controls (Supplementary Fig 1a–d). Differences in urinary excretion of individual electrolytes and baseline blood pressure measurements were also not statistically significant (Supplementary Fig 1e–i).
As the PT reabsorbs the majority of filtered K+, we next investigated how deletion of Kir4.2 affected kidney electrolyte handling under low K+ stress. After consuming a K+-deficient (0 K) diet for four days, blood electrolyte analysis revealed knockouts had lower blood K+ levels compared to controls (Fig. 1a). They exhibited higher blood Na+ and Cl– levels along with reduced blood HCO3−, findings consistent with a proximal renal tubular acidosis (RTA) (Fig. 1b–d). Aside from modestly elevated blood Cl– in the knockout group, large differences in blood electrolytes were not detected between genotypes following consumption of a NaCl-deficient diet for four days suggesting the channel is essential for the renal response to dietary K+, but not Na+, restriction (Supplementary Fig 2a–d).
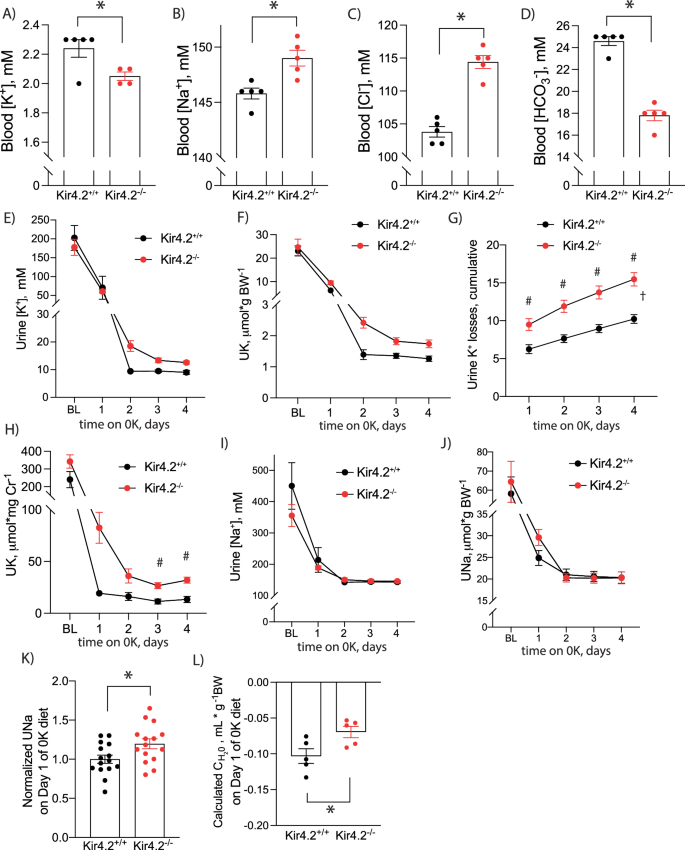
Blood (A) K+(p = 0.034), (B) Na+ (p = 0.0059), (C) Cl− (p = 3 × 10⁻⁵), and (D) HCO3− (1.5 × 10⁻⁴) values in Kir4.2+/+ and Kir4.2−/− animals after four days on 0 K diet. Daily urine K+ (E) concentration and (F) excretion at baseline and on 0 K diet for indicated time. G Cumulative urine K+ losses on 0 K diet (p = 0.0068, 0.0002, <0.0001, <0.0001). H Urine K+ excretion normalized to creatinine from spot urines collected from animals at baseline and on 0 K diet for indicated times (p = 0.018, 0.0096). Daily urine Na+ (I) concentration and (J) excretion at baseline and on 0 K diet for indicated time. K Normalized daily hour urine Na+ excretion in mice consuming a 0 K diet for 1 day (p = 0.024). L Calculated free water clearance for mice consuming a 0 K diet for 1 day (p = 0.032). N = 5 per group for (A–D) and (L) except (A) where N = 5 for Kir4.2+/+ and 4 for Kir4.2−/−. One knockout blood K+ sample was excluded for the presence of gross hemolysis. N = 10 per group for (E–J) and 15 per group for (K). *P < 0.05 by unpaired t test. #P < 0.05 for genotype difference at indicated timepoints by two-way ANOVA with repeated measures followed by Sidak’s multiple comparison test. †P < 0.05 for interaction between treatment and time variables by two-way ANOVA with repeated measures. All tests were two-sided. Data presented as mean ± sem.
These findings were suggestive of renal K+ wasting in our knockout animals, so we performed metabolic cage experiments to measure overnight urine electrolyte excretion during the animals’ active period. While animals from both genotypes reduced their urine K+ concentrations and total daily urine K+ excretion on the 0 K diet, both parameters remained higher in Kir4.2−/− mice compared to controls, although differences did not achieve significance by post-hoc testing (Fig. 1e, f). Cumulative urine K+ losses were significantly greater in knockout animals supporting a K+ wasting phenomenon underlying their reduced blood K+ (Fig. 1g). Urinary K+ wasting could also be detected in Kir4.2−/− mice via daily spot urine collections validating spot urine use for future studies (Fig. 1h). Daily urine Na+ concentrations and total daily urine Na+ excretion were not different between genotypes at individual timepoints by post-hoc testing either, but there was a trend towards higher total urine Na+ excretion in knockouts on the first day of 0 K treatment (Fig. 1i, j). Pooling normalized data revealed higher urine Na+ in Kir4.2−/− mice after one day of 0 K consumption (Fig. 1k). Knockouts also excreted more free water during this first day of treatment (Fig. 1l).
Potassium wasting in Kir4.2 knockouts is a distal phenomenon mediated by ENaC
While the majority of the filtered electrolyte load, including K+, is reabsorbed proximally, previous reports have suggested K+ wasting in proximal RTA occurs distally19. K+ secretion along the connecting tubule (CNT) is mediated by apical K+ channels, which secrete K+ in response to a negative lumen potential generated by Na+ reabsorption via the epithelial Na+ channel (ENaC). To determine if K+ wasting observed in knockout animals is dependent on a Na+ load, we again treated animals of both genotypes with a K+-deficient diet but varied dietary Na+ in the setting of 0 K. Removal of dietary Na+ from the 0 K diet reduced K+ wasting in Kir4.2−/− mice on a 0 K diet compared to knockouts consuming a 0.3% Na+/0 K diet (Fig. 2a, b).
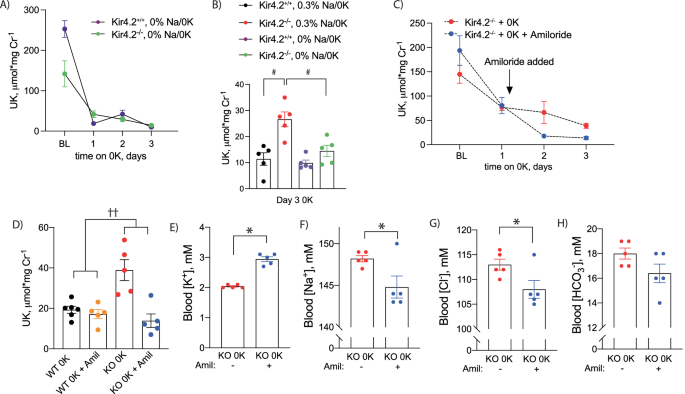
A Urine K+ excretion at baseline and on 0 K diet for indicated timepoints in Kir4.2+/+ and Kir4.2−/− mice. Diet contained 0% Na+ with 0 K (purple and green). B Urine K+ excretion on day three of 0 K from animals treated with normal Na+ or as in (A). Note black and red data (both genotypes on 0.3% Na+) are from panel 1 h (p = 0.0011 and 0.0082). Urine (C) K+ excretion at baseline and on 0 K diet in Kir4.2−/− mice. Amiloride was added to drinking water at indicated time point (p = 0.02). D Comparison of urine K+ excretion between Kir4.2+/+ and Kir4.2−/− mice after three days of consuming a 0 K diet with and without amiloride treatment (p = 0.0027 for interaction). Blood (E) K+ (p = 5 × 10⁻⁶) (F) Na+ (p = 0.038), (G) Cl– (p = 0.044), and (H) HCO3− from Kir4.2−/− mice treated as in (C). N = 5 for all, except day 1 of 0 K in 2a where n = 2 and 4 (3 Kir4.2+/+ and 1 Kir4.2−/− animals did not consume diet and so data were not included in analysis), and N = 6 for WT 0 K in (D). #, P < 0.05 for genotype difference at indicated timepoints by two-way ANOVA with or without repeated measures followed by Sidak’s multiple comparison test. *P < 0.05 by unpaired t test. ††p < 0.05 for interaction by two-way ANOVA. All tests were two-sided. Data presented as mean ± sem.
To formally test if Na+ reabsorption via ENaC underlies excessive distal K+ secretion, we treated knockout mice on a 0 K diet with either regular drinking water or water supplemented with the ENaC inhibitor, amiloride (75 mg/L). As presented in Fig. 2c, amiloride treatment prevented K+ wasting observed in knockout animals on normal drinking water, but it did not cause a significant change in urine Na+ excretion (Supplementary Fig 3a). Amiloride did not have a detectable effect on Kir4.2+/+ animals on 0 K while it returned Kir4.2−/− urine K+ to levels that were indistinguishable from Kir4.2+/+ mice suggesting it completely prevented K+ wasting (Fig. 2d). Correcting the K+ wasting also ameliorated the hypokalemia caused by the 0 K diet (Fig. 2e). Blood Na+ and blood Cl– were reduced as well suggesting amiloride prevented the water wasting observed in knockouts (Fig. 2f, g). This was supported by higher urine osmolality in the amiloride-treated group (Supplementary Fig 3b). Amiloride did not impact blood HCO3– levels suggesting acid-base disturbances were primarily of proximal origin (Fig. 2h). A reduction in Kir4.2−/− urine K+ was also observed following treatment with the chemically distinct ENaC inhibitor, triamterene, to further demonstrate the role of ENaC in mediating the K+ wasting observed in knockout animals (Supplementary Fig 3c).
Stimulated distal transport pathways compensate for proximal Na+ losses in Kir4.2−/− mice
These data supported increased ENaC activity in knockout animals. Therefore, we next measured abundance of ENaC subunits. While we could not detect differences in αENaC, we did observe increased cleavage of the γ subunit (Fig. 3a, d, e). This was accompanied by elevated plasma aldosterone levels in knockouts (Fig. 3c). NCC is also essential for distal nephron regulation of K+ balance7,20. We detected increased phosphorylation (pNCC) and total abundance of NCC in knockout mice (Fig. 3b, f, g). Total NKCC2 abundance was also increased in Kir4.2−/− animals compared with controls (Fig. 3a, h). Abundance of the distal nephron basolateral K channel, Kir4.1, did not differ between genotypes (Supplementary Fig 4). To confirm that increased pNCC abundance reflected increased function in vivo, we performed an HCTZ-response test in Kir4.2+/+ and Kir4.2−/−animals. Knockouts demonstrated increased natriuretic and kaliuretic responses to acute HCTZ treatment (Fig. 3i, j). Similarly, knockouts had an increased kaliuretic response to acute furosemide treatment, though the increase in natriuretic response did not quite meet the threshold for statistical significance (Fig. 3k, l). We measured the calciuretic response to furosemide, as loop diuretics also increase urine calcium excretion, and observed knockouts had an increased calcium response further supporting their increased NKCC2 activity (Fig. 3m). Overall, functional data corroborate Western blot results and support increased ENaC, NCC, and NKCC2 activity in knockout mice.
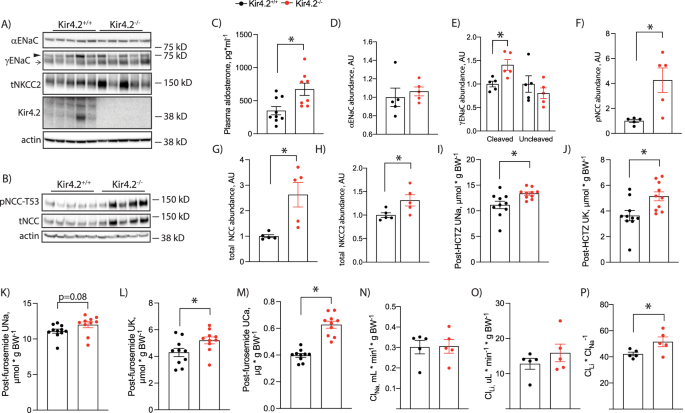
Total kidney abundances of (A) αENaC, γENaC, total NKCC2, Kir4.2 and (B) pNCC-T53 and total NCC in Kir4.2+/+ and Kir4.2−/− animals. ► uncleaved γENaC, → cleaved γENaC. C Plasma aldosterone concentrations in Kir4.2+/+ and Kir4.2−/− animals (p = 0.0096). D–H Quantification for blots shown in (A) and (B) (p = 0.013 for (E), 0.011 for (F), 0.010 for (G), and 0.041 for (H)). I Natriuretic and (J) kaliuretic responses of Kir4.2+/+ and Kir4.2−/− mice following acute HCTZ treatment (p = 0.013 for I and 0.012 for ( J). K Natriuretic, (L) kaliuretic, and (M) calciuretic responses of Kir4.2+/+ and Kir4.2−/− mice following acute furosemide treatment (p = 0.0081 for L and for 1.5 × 10⁻⁴ for (M). Renal (N) Na+ clearance (ClNa) and (O) Li+ clearance ClLi, and (P) Li+ clearance to Na+ clearance ratio (ClLi/ClNa) in Kir4.2+/+ and Kir4.2−/− mice (p = 0.047). Animals were on normal diets for all panels. N = 5 per group for (A, B, D–H and N–P), 9 and 8 per group for (C), and N = 10 per group for (I–M). *P < 0.05 by Student’s t test. All tests were two-sided. Data presented as mean ± sem.
To determine if distally increased Na+ reabsorption offsets proximal reductions, we performed Li+ clearance (ClLi) studies. These studies revealed that differences in renal Na+ clearance (ClNa) or ClLi by themselves did not differ between genotypes, but the ClLi to ClNa ratio was increased in Kir4.2−/− mice consistent with reduced proximal Na+ transport (Fig. 3n–p).
Low K+ stress fails to induce PT expansion while the distal response is exaggerated in Kir4.2 knockout animals
Low K+ conditions impose significant metabolic stress along the nephron. This includes increased Na+ reabsorption along both proximal and distal nephron segments4 and activation of gluconeogenic and ammoniagenic pathways2,3. Coupled with this increased metabolic activity, the hypokalemic kidney undergoes a significant growth response1. We observed increased kidney weight in control animals following four days of 0 K treatment; mass further increased after eight days of K+ deficiency (Fig. 4a). A detectable increase in gross kidney mass was absent in mice lacking Kir4.2. Nephron segment expansion in response to low K+ has been well-documented along both proximal and distal nephron segments21. Despite absent whole kidney enlargement, optical clearing followed by three-dimensional confocal imaging revealed increased DCT volume in Kir4.2 knockouts following 0 K feeding compared to controls (Fig. 4b, c). We next measured PT diameter and cortical thickness using a similar approach based on LTL staining. These analyses revealed knockout animals on 0 K had significantly reduced cortical thickness and PT diameter compared to Kir4.2+/+ mice (Fig. 4d–g, Supplementary Fig 5).
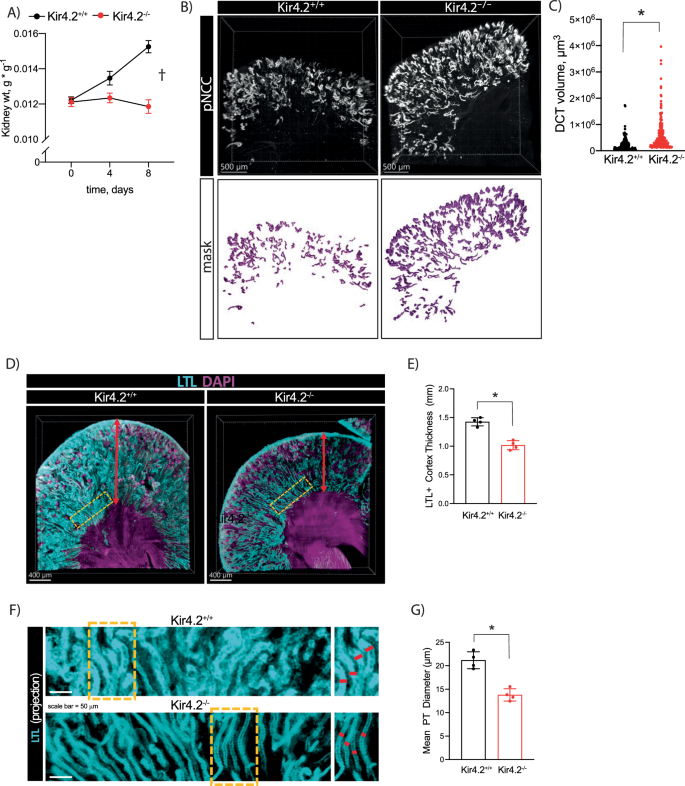
A Kidney mass from Kir4.2+/+ and Kir4.2−/− mice on 0 K diet at indicated timepoints (p < 0.0001 for interaction). B Representative three-dimensional images from optically cleared Kir4.2+/+ and Kir4.2−/− kidneys stained for pNCC-T53. Animals were maintained on 0 K diet for eight days. C Quantification of DCT volume based on imaging as described in B (3.4 × 10⁻¹⁰). D Representative three-dimensional images from optically cleared Kir4.2+/+ and Kir4.2−/− kidneys stained with LTL-fluorescein and DAPI. Animals were maintained on 0 K diet for eight days. Yellow boxes indicate sections highlighted in (F). E Quantification of cortical thickness based on imaging as described in (D) (p = 2.5 × 10⁻⁴). F Representative 2-D projections from optically cleared Kir4.2+/+ and Kir4.2−/− kidneys stained with LTL-fluorescein. Yellow boxes indicate sections highlighted on the right. G Quantification of tubule thickness based on imaging as described in (F) (p = 5.8 × 10⁻⁴). In (A), N = 10 (t = 0), 5 (t = 4), and 11 (t = 8) for Kir4.2+/+ and N = 10 (t = 0), 15 (t = 4), and 14 (t = 8) for Kir4.2−/−, for (B–G), N = 3 per group †P < 0.05 for interaction between treatment and time variables by two-way ANOVA with repeated measures. * indicates P < 0.05 by unpaired Student’s t test. All tests were two-sided. Data presented as mean ± sem.
AKT controls renal Na+ and K+ handling and its regulation is disrupted following Kir4.2 deletion
Defective proximal expansion in Kir4.2−/− animals, prompted us to examine activation of growth signaling pathways in our mice. Notably, we detected increased phosphorylation of AKT (pAKT) at serine 473 in control animals on 0 K, a finding that was not observed in knockouts (Fig. 5a, Supplementary Fig 6a, b). AKT isoform-specific phospho-antibodies indicated both pAKT1 and pAKT2 were increased in response to low K+ (Fig. 5b, Supplementary Fig 6c, d). Consistent with previous reports22, AKT3 was not detected in the kidney (Supplementary Fig 6e). In Kir4.2+/+ animals, AKT staining adopted a punctate pattern in the PT both at baseline and following 0 K feeding (Fig. 5c, d, Supplementary Fig 6f, g, Supplementary Fig 7). AKT is generally known to be a key regulator of cell growth and metabolism, but its role in the kidney and if it is involved in ion transport regulation, is less well-defined. To determine this, we measured the renal response to treatment with the AKT inhibitor, MK2206. Wild-type animals exhibited a natriuretic and kaliuretic response in the four hours following acute MK2206 administration at both 50 mg/kg and 25 mg/kg (Fig. 5e, Supplementary Fig 8a). This response was exaggerated following the consumption of a 0 K diet (Fig. 5f, Supplementary Fig 8b, c). While a diuretic response was not apparent on a normal K+ diet, MK2206 did increase urine volume on 0 K (Fig. 5g). MK2206 did not affect the urine Na+ to K+ ratio under either dietary condition suggesting the distal nephron is not the dominant site mediating our observation (Fig. 5h). Since we observed reduced pAKT abundance in Kir4.2−/− animals on a K+ deficient diet, we next compared the MK2206 response of knockouts and control animals on 0 K. The natriuretic and diuretic responses trended towards being reduced in Kir4.2−/− animals, but did not achieve statistical significance (Fig. 5i, Supplementary Fig 8d). The kaliuretic response, however, was blunted in knockouts compared to controls (Fig. 5j). Strongly supporting a role for AKT signaling in the renal hypertrophic response to low K+ was the absence of an increase in kidney mass in wild-type animals treated with MK-2206 while consuming a K+-deficient diet for four days compared to vehicle-treated mice on an identical diet (Fig. 5k).
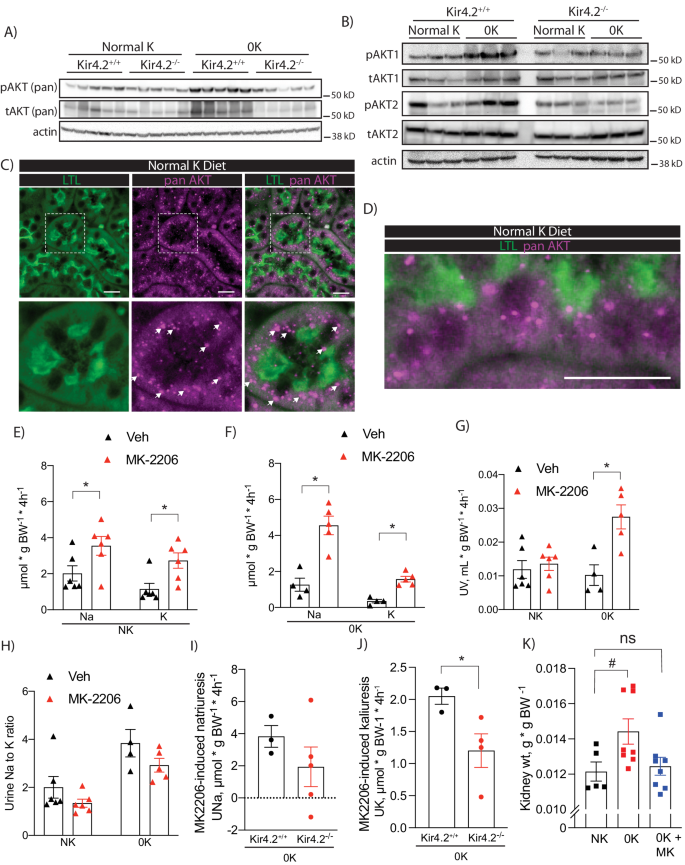
A Representative Western blots for pan pAKT-S473 and pan total AKT from Kir4.2+/+ and Kir4.2−/− kidneys following normal K+ and 0 K dietary treatments. Quantification presented in Supplementary Fig. 5.B Representative Western blots using isoform-specific antibodies for pAKT1, total AKT1, pAKT2, and total AKT2 from mice treated as in (A). Quantification presented in Supplementary Fig. 5. C and D Representative immunofluorescence imaging showing colocalization of AKT and the PT marker LTL in mice maintained on a normal diet. Arrows indicate punctate staining of AKT. Urinary Na+ and K+ excretion following treatment with either vehicle (Veh) or MK-2206 in wild-type animals on either (E) normal K+ (NK, p = 0.046 and 0.014) diet or (F) 0 K diet (p = 0.0059 and 0.0079). G Diuretic response (p = 0.0092) and (H) the urine Na-to-K ratio following to the same treatments as in (D). MK-2206-induced (I) urine Na+ and (J) K+ response in Kir4.2+/+ and Kir4.2−/− animals (p = 0.048). Each data point presented for (I) and (J) is the difference between MK-2206- and vehicle-induced electrolyte excretion for each animal. K Kidney weights from normal K-fed (NK) mice, 0K-fed (0 K) mice, and 0K-fed mice that were also treated with MK-2206 (0 K + MK) for four days (p = 0.046). N = 5 per group for all in (A, C), N = 3 per group for (B), N = 6 per group for (E), and N = 4 for Veh and 5 for MK-2206 for (F). In (G), N = 6, 6, 4 and 5. In (H), N = 5, 6, 4, and 5. N = 3 for Kir4.2+/+ and 4 for Kir4.2−/− in (I) and (J). For (K), N = 5, 8, and 8 respectively. * indicates p < 0.05 by unpaired Student’s t test. # indicates P < 0.05 by one-way ANOVA followed by Dunnett’s post-hoc test. Scale bars = 20 μM. All tests were two-sided. Data presented as mean ± sem.
Kir4.2−/− mice have reduced phosphorylation of mTOR targets on 0 K
Inhibition of kidney growth with both AKT inhibition and Kir4.2 deletion suggested a common mechanism. We detected mTOR staining along the PT as determined by immunofluorescent costaining with LTL (Fig. 6a). Kir4.2−/− animals on 0 K had reduced phosphorylated mTOR abundance compared with control mice (Fig. 6b, Supplementary Fig 9a, b). Knockouts also had reduced abundances of phosphorylated targets downstream of mTOR signaling including P70S6 kinase, ribosomal protein S6, eIF4G, and NDRG1 (Fig. 6c, d Supplementary Fig 9c–f). Total abundances of NBCe1 and NHE3 were also both reduced in Kir4.2−/− mice on 0 K compared to controls (Fig. 6e, Supplementary Fig 9g, h). Further supporting reduced PT NHE3 function was a reduction in urine ammonia excretion in knockouts (Fig. 6f).
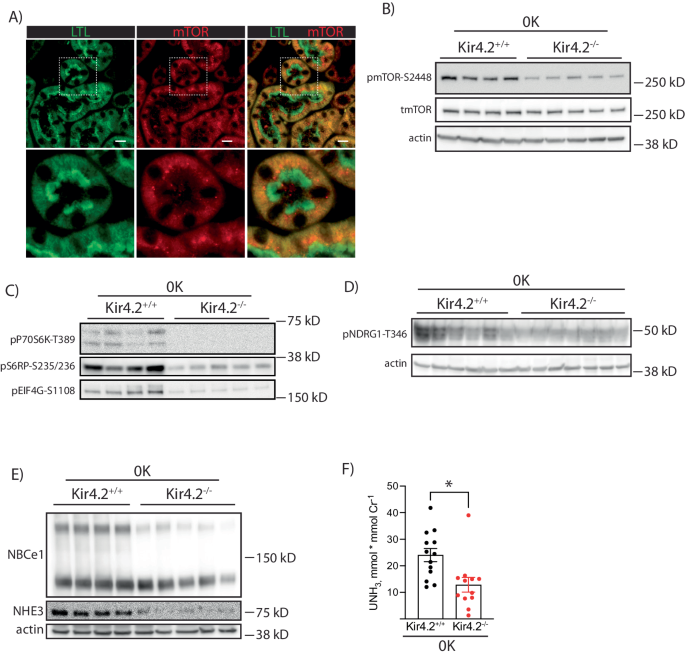
A Representative immunofluorescence staining for LTL and mTOR along the proximal tubule. B Representative Western blots for total mTOR and pmTOR-S2448 from Kir4.2+/+ and Kir4.2−/− mice treated with 0 K. Quantification shown in Supplementary Fig. 4.C Representative Western blots for pP70S6 kinase-T389, pS6RP-S235/236, pEIG4G-S1108, and (D) pNDRG1-T346 from Kir4.2+/+ and Kir4.2−/− mice treated with 0 K. Loading control for (C) is same as in (B). Quantification shown in Supplementary Fig. 4.E Representative Western blots for NBCe1 and NHE3, from Kir4.2+/+ and Kir4.2−/− mice treated with 0 K. Quantification shown in Supplementary Fig. 7.F Urine ammonia excretion from Kir4.2+/+ and Kir4.2−/− mice treated with 0 K. 0 K treatment was given for 8 days for (B–F). For (A), N = 5 per group. For (B, C, E), N = 4 for Kir4.2+/+ and 5 for Kir4.2−/−. Panel (D) is a representative image from N = 10 and 12. For (F) N = 13 and 12. * indicates P < 0.05 by unpaired Student’s t test. Scale bar = 20 μM. All tests were two-sided. Data presented as mean ± sem.
Renal mTORC2/AKT signaling is activated via PT basolateral Cl– transport in response to reduced extracellular K+
To determine the underlying mechanism by which low K+ activates mTOR and AKT we moved to an ex vivo tubule suspension model. Reductions in extracellular K+ are known to stimulate K+-sensitive pathways in this model and we were able to confirm increased pNCC in this setting as a positive control (Supplementary Fig 10a)23. To determine if reduced extracellular K+ itself is capable of increasing pAKT, we cultured tubule suspensions in either 6 mM K+ or 0 mM K+ for 30 min and found significant increases in pAKT while total AKT abundance remained unchanged (Fig. 7a). This effect was graded throughout the entire range of physiological extracellular K+ (Fig. 7b). This effect was not sensitive to rapamycin, which predominantly inhibits the mTORC1 complex (Supplementary Fig 10b), but it was prevented with the mTORC2 inhibitor AZD8055 (Fig. 7c). We next observed low K+-mediated phosphorylation of mTOR target proteins, including p70 S6 kinase, S6 ribosomal protein, and NDRG1 (Fig. 7d). These were the same phosphosites that were reduced in Kir4.2−/− animals on 0 K (Fig. 6). While activation of these targets is largely dependent on the mTORC1 complex, we investigated if there was activation of mTORC1 downstream of mTORC2/AKT. In support of this, we observed low K+-dependent phosphorylation of mTOR itself and TSC2, which is known to mediate crosstalk between mTORC2 and mTORC1 signaling. AKT inhibition with MK2206 treatment in the tubule system prevented each of these phosphorylation events (Fig. 7d).
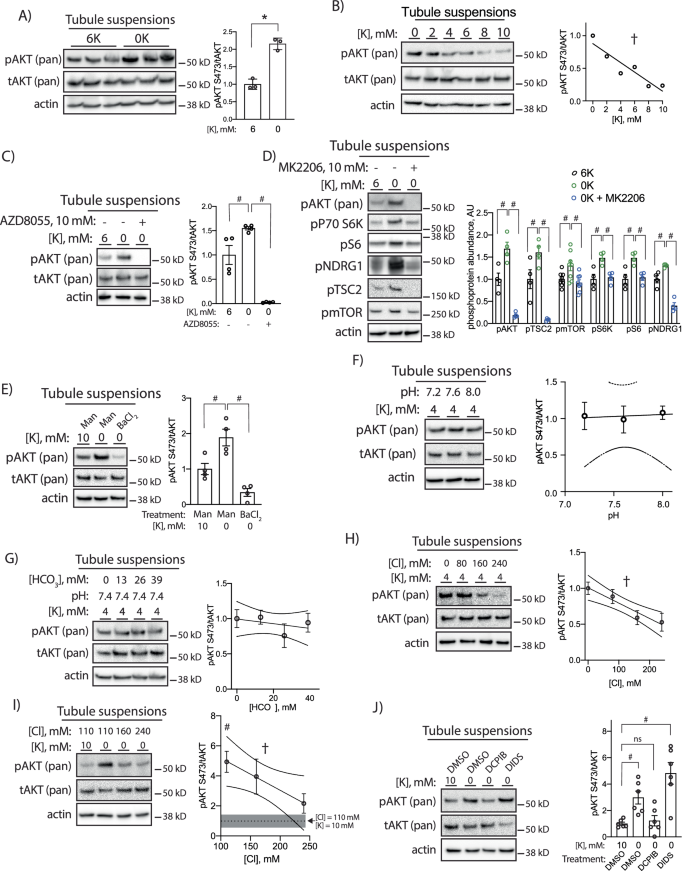
A Western blots from isolated tubule suspensions cultured for 30 min in either 6 mM or 0 mM K+ conditions (p = 8.5 × 10⁻⁴). B Representative Western blots from isolated tubule suspensions cultured for 30 min in indicated K+ concentrations (p = 0.008 for nonzero slope). C Representative Western blots from isolated tubule suspensions cultured for 30 min in indicated K+ concentrations with or without the mTORC2 inhibitor AZD8055 (10 μM) (p = 0.019 and <0.0001). D Representative Western blots from isolated tubule suspensions cultured for 30 min in indicated K+ concentrations with or without the AKT inhibitor MK2206 (10 μM) (p = 0.0069 and <0.0001 for pAKT, p = 0.044 and 0.0001 for pTSC2, p = 0.043 and 0.0092 for pmTOR, p < 0.0001 and p < 0.0001 for pP70S6K, p = 0.0078 and 0.013 for pS6, and p = 0.02 and <0.0001 for pNDRG1). E Representative Western blots from isolated tubule suspensions cultured for 30 min in indicated K+ concentrations with medium supplemented with either mannitol (30 mM) or BaCl2 (10 mM) (p = 0.015 and 0.0004). F Representative Western blots from isolated tubule suspensions cultured for 30 min in 4 mM K+ at indicated pH. G Representative Western blots from isolated tubule suspensions cultured for 30 min in 4 mM K+ and pH 7.4 at indicated HCO3− concentrations. H Representative Western blots from isolated tubule suspensions cultured for 30 min in 4 mM K+ at indicated Cl– concentrations (p = 0.0009 for nonzero slope). I Representative Western blots from isolated tubule suspensions cultured for 30 min in indicated K+ and Cl– concentrations (p = 0.043 for nonzero slope). J Representative Western blots from isolated tubule suspensions cultured for 30 min in indicated K+ concentrations and either DMSO, DCPIB (10 μM), or DIDS (100 μM) (p = 0.036 and 0.0001). N = 3 per group for (A, F–I), 4 per group for (C, E), 4 per group for (D) except pmTOR for which N = 8, and 6 per group for (J). * indicates P < 0.05 by unpaired Student’s t test. # indicates P < 0.05 by one-way ANOVA followed by Tukey’s (C–E) or Dunnett’s (I, J) post-hoc test. † indicates P < 0.05 for slope being significantly different than 0. In I, post-hoc comparisons are made between the indicated group and the 10 mM K+, 110 mM Cl- group, the abundance of which is indicated by a dotted line and SEM indicated by the shaded gray area. All tests were two-sided. Data presented as mean ± sem.
Potassium-induced phosphorylation events that occur along the distal nephron are mediated by changes in membrane voltage5,7. To determine if this was also the case for AKT, we treated cells with barium, which inhibits Kir channels, and found this completely prevented low K+ increases in pAKT (Fig. 7e). Reducing extracellular K+ also has effects on cytosolic pH, causing intracellular acidosis due to increased bicarbonate efflux24. To determine if altering pH affects pAKT abundance, we cultured tubules in 4 mM K+ while varying medium pH, and found this did not affect pAKT abundance (Fig. 7f). When we varied medium HCO3– in the setting of stable pH and K+, we similarly found that pAKT abundance was not affected (Fig. 7g).
Distally, low K+-induced changes in membrane voltage influence phosphorylation events via changes in intracellular Cl– concentration6. Here we also found that reductions in medium Cl– increased pAKT abundance in a 4 mM K+ bath (Fig. 7h). Raising medium Cl– also prevented low K+-induced AKT phosphorylation (Fig. 7i). These data were consistent with a Cl– efflux event reducing intracellular Cl– concentration to stimulate mTORC2 and AKT. A recent report demonstrated the PT basolateral VRAC channel regulates PT function and its deletion in mice caused Fanconi syndrome25. To determine if low K+-induced Cl– exit via PT basolateral VRAC channels, we treated cells with the VRAC inhibitor DCPIB in the setting of low K+ culture. DCPIB completely prevented increased pAKT observed in low K+ conditions (Fig. 7j). The phosphorylation event was not prevented with the nonspecific Cl−-channel blocker, DIDS.
Data thus far were consistent with an effect of cell Cl– modulating PT mTORC2/AKT activity; however, reduced cell volume in response to low extracellular K+ could also be contributing to kinase activation. The WNK kinases, while being modulated by Cl–, are also known to be molecular crowding sensors and are activated by cell shrinkage26. To test if kidney AKT is activated by reduced cell size, we treated tubules with a hypertonic stimulus to induce cell shrinkage. In contrast to effects of a 0 mM K+ bath, treatment with 50 mM mannitol did not alter AKT phosphorylation (Fig. 8a). Similarly, treatment with 50 mM sorbitol did not affect phosphorylated AKT abundance, while hypertonic NaCl (additional 50 mM) tended to reduce pAKT (Fig. 8b).
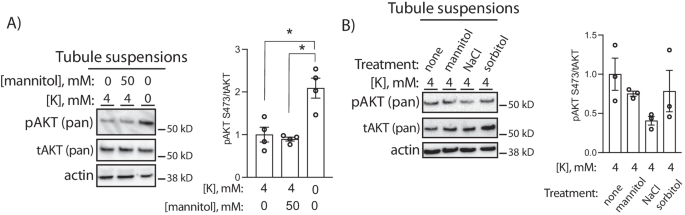
A Representative Western blots from isolated tubule suspensions cultured for 30 min in either 0 or 50 mM mannitol at indicated K+ concentrations. B Representative Western blots from isolated tubule suspensions cultured for 30 min at 50 mM concentrations of indicated solute. * indicates P < 0.05 by one-way ANOVA followed by Tukey’s post-hoc test. N = 4 per group in A and 3 per group in (B). All tests were two-sided. Data presented as mean ± sem.
- The Renal Warrior Project. Join Now
- Source: https://www.nature.com/articles/s41467-024-49562-w